Introduction
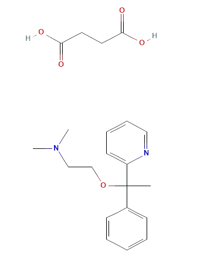
Doxylamine succinate (DOX) is an Histamine H1 antagonist with pronounced sedative properties. It is used in allergies and as an antitussive, antiemetic, and hypnotic. Doxylamine has also been administered in veterinary applications and was formerly used in parkinsonism. Doxylamine Succinate (DOX), chemically it is butanedioic acid; dimethyl({2-[1-phenyl-1-(pyridin-2-yl)ethoxy]ethyl})amine (Figure 1). Doxylamine Succinate is an antihistamine, used to relieve symptoms of allergy, hay fever, and the common cold. This effect helps to relieve allergy, cold symptoms such as Also used in the combination with Vitamin B6 (pyridoxine) to prevent morning sickness in pregnant women . The combined dosage forms of DOXY and PYRI are available in the market for the treatment of vomiting during pregnancy. It is official in BP and USP.
Literature survey revealed that numbers of RP-HPLC methods are available for DOX in combination with other drugs and. RP-HPLC method was also reported for the DOX. UV Spectrophotometric method like simultaneous equation method and First derivative Spectrophotometry were reported. The method was validated as per ICH guidelines.
Experimental
Preliminary solubility studies and selection of solvent
Solubility of DOX was found in Distilled Water and Ethanol. The Doxylamine succinate is completely soluble in Distilled water. So for further study Distilled water is used as a solvent.
Preparation of stock standard solution
Stock standard solution of DOX was prepared by dissolving accurately weighed 10mg of DOX into 100ml of Distilled water, to obtain concentration of 100µg/mL. sonicated for 5 min. The working standards were prepared by dilution of the stock standard solution.
Determination of λ max and calibration curve
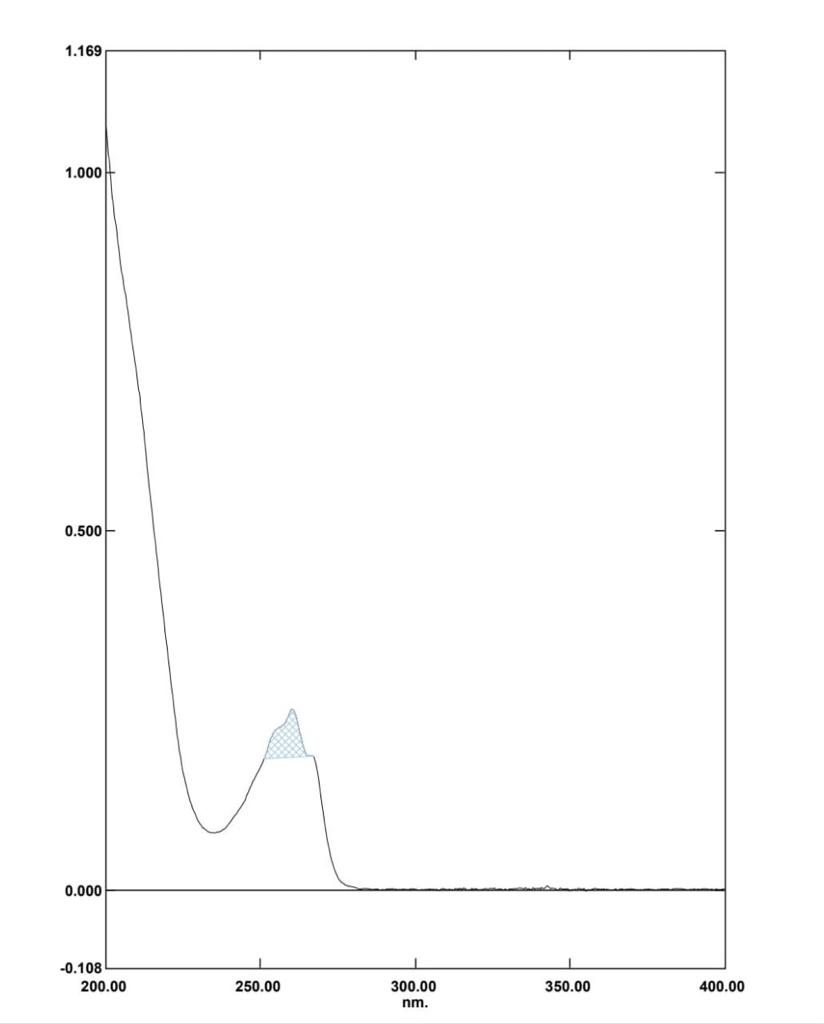
A fixed volume of 1.0mL of DOX from stock solution was transferred to 10mL volumetric flask, diluted to mark with Distilled water to obtain concentration of 10µg/mL. The resultant solution was scanned in UV range (400-200nm) in 1.0cm cell against solvent blank. The spectrum showed an absorption maximum at 260nm.
In Method I absorbance at 260nm was considered for analysis while for Method II two wavelengths 251.20-267.20 nm were selected for determination of Area under Curve [AUC]. Zero order UV-spectrum showing maximum absorbance and AUC are shown in Figure 3.
Table 1
Optical characteristics and linearity of doxylamine succinate
Method I. UV-spectrum of Doxylamine succinate in Distilled water showing λmax (260 nm)
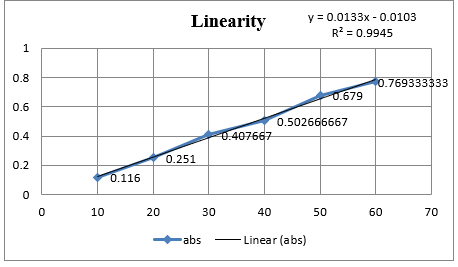
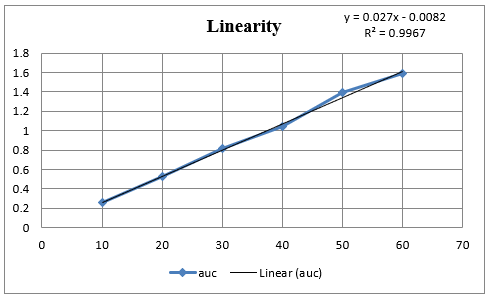
An appropriate volume of stock solution in the range of 1ml –6mL were transferred in series of 10mL volumetric flask, volume was made up to 10mL with Distilled water to get concentration of 10–60µg/mL and absorbance was measured at 260nm (method I) and Zero order- AUC was recorded in between the wavelength range of 251.20-267.20 nm (Method II) against the blank. Calibration curves were prepared by plotting concentration versus absorbance and AUC as shown in Figure 3.
Analysis of Tablet formulation
Ten tablet were accurately weighed and average weight determined, an amount of power drug equivalent to 10 mg of Doxylamine succinate was transfer into 100 mL volumetric flask containing 100 ML of Distilled water, sonicated for 5 min. The volume was made up to the mark with same solvent and filtered through 0.45µm Whatman filter paper. A suitable volume of solution was further diluted with Distilled water to obtain concentration 30µg/mL of Doxylamine succinate for tablet assay. These sample solutions were scanned at selected wavelengths in Method I and Method-II and the results were obtained. From the respected linear regression equations, the concentrations were determined. The procedure was repeated five times and the results are shown in Table 2.
Table 2
Analysis of doxylamine succinate tablet
|
|
Label claim(mg) |
Conc (µg/mL) |
%Amount found n=5 |
±SD |
±RSD |
|
Method 1 |
25 |
30 |
101.1779 |
0.002915 |
0.704221 |
|
Method 2 |
25 |
30 |
99.9012346 |
0.00594138 |
0.726863263 |
Validation
The method was validated for accuracy, precision and ruggedness according to ICH guidelines27.
Accuracy/recovery studies
To estimate the accuracy of both the proposed methods, recovery studies were executed out at 80, 100 and 120% of the test concentration as per ICH guidelines. To the pre-analyzed sample solution (10µg/ml), a known amount of drug standard was added at 80, 100 and 120% and solutions were reanalyzed by proposed methods. 1, 2, 3, 4, 5, 6, 7 The experiments were performed for three times at each level for each method. The results of the recovery studies are reported in below table.
Average of Three Estimates
Precision
Precision of the methods were studied as intra-day, inter-day variations and repeatability. Precision was determined by analyzing the concentration of 20, 30, and 40µg/ml. To determine the degree of repeatability of the methods, statistical evaluation was carried out , and the results are reported in below table.
Repeatability
Repeatability was determined by analyzing doxylamine succinate concentration of 30µg/mL for five times and results are reported in below table.
Ruggedness
Ruggedness of the proposed method was determined by analysis of aliquots from homogenous slot by two analyst using same operational and environmental conditions and the results are reported in below table.
Sensitivity
The sensitivity of proposed methods was estimated in terms of estimating Detection Limit (DL) and Quantitation Limit (QL) which were calculated using formulae “DL = 3.3 ×N/B,” and “QL = 10 × N/B” where “N” is average standard deviation of the absorbance or peak areas of the doxylamine succinate (n = 3), taken as a measure of noise, and “B” is the slope of the corresponding calibration curve.
Results and Discussion
In the present investigation, water-soluble drugs Doxylamine succinate in bulk and in tablet. By selecting proper solvent. For the solubility studies, different solvent was tried but optimum solubility was achieved in Distilled water. In Method I and II, linearity of Doxylamine succinate was found to be in the range of 10 - 60µg/mL, with correlation coefficient (r2 > 0.99). Marketed brand of Tablet were analyzed. The amounts of Doxylamine succinate determined by ‘Method I’ and Method II was found to be 101.177% and 99.90 respectively. In both these methods, precision was studied as repeatability, inter and intra-day variations at three different concentrations of Doxylamine succinate and % RSD was found to be less than 2. The accuracy of method was determined by calculating mean percentage recovery. 8, 9, 10 It was determined at 80, 100 and 120% level and % recovery was found to be in the range 101% - 100.90%, 99.19% - 101.13 and 100.75% 100.83% for method I and II respectively. The ruggedness of the methods was studied by two different analysts using the same operational and environmental conditions and % RSD found to be less than 2. DL and QL were found to be 0.53811271µg/ml and 1.63064457µg/ml, respectively for Method I and DL and QL were found to be 0.432120811µg/ml and 1.309457002µg/ml respectively for Method II indicating adequate sensitivity of the methods.