Introduction
Conventional rapid dissolving tablets provide clinically effective therapy for numerous pharmacological substances by maintain the required balance of pharmacokinetic and pharmacodynamic parameters while an acceptable level of patient safety. Because of patient acceptance, ease of administration,cost-effective manufacture, drug delivery is the most desirable and preferred technique of providing therapeutic agents to achieve systemic effects. These agents are designed to have the highest levels of stability, activity, and bioavailability.1
A disintegrant is an excipient is added to a tablet or capsule blend to promote breakup of the compacted mass when it is put into a fluid environment. In many cases disintegrants have the major role in the disintegration and dissolution process of rapidly disintegrating tablets made by direct compression these are agents added to tablets and some encapsulated formulations to promote breakup of tablets and capsules slugs into smaller fragments in the aqueous environment thereby increasing the available surface area and promote more rapid release of drug substance.2, 3
Materials and Methods
Isolation and purification of sida acuta 4, 5
The leaves from Sida acuta plant collected and dried, powdered, and passed through a sieve for uniform size. A 200 g of the sieved dried leaves powder was mixed and macerate with 1500 ml of distilled water for 6 h. The mixture was boiled for 1 h at 1000C to ensure complete break–up of cells to release the mucilage and kept aside for settling. After 2 h of boiling, the mixture was filtered. To the filtrate (900 ml), equal volumes of isopropyl alcohol were added and kept in a refrigerator at 8–100C for 6 h. The left marc, 1000 ml of distilled water was added and kept for about 1 h to wash out the remaining mucilage. The mucilage (1200 ml) was separated from the marc using a muslin cloth and precipitated with equal volumes of isopropyl alcohol. The hydrogel was purified by using isopropyl alcohol and acetone. The hydrogel was soaked into two volumes excess of isopropyl alcohol. The hydrogel-solvent slurry was allowed to stand for 30 min. The precipitate was collected by filtration using a muslin cloth. washed twice with isopropyl alcohol and once with acetone. Finally, it was dried in the oven at 40 °C for 8 h. The hydrogel was stored separately in a clean, dry and closed container. This process was carried out in three times.
Preformulation Studies 6, 7, 8, 9
Preformulation studies describes as the process of optimizing the delivery of drug through the determination of physic-chemical properties of the new compound that could affect the drug performance and development of an efficacy, stable and safe dosage form.
Organoleptic Properties of Drug
Colour- A small amount of powder was taken in butter paper and viewed in well illuminated place.
Odour & Taste-Less quantity of drug was used to get taste with the help of tongue as well as smelled to get the odour.
Determination of Melting Point- Melting point was determined by taking small amount of drug in a capillary tube closed at one end. The capillary tube was placed in an electrically operated melting point and to note down the reading temperature at which the drug melts. This was performed thrice and average values.
Solubility Analysis
Solubility can be determined by adding the solute in small incremental amount to fixed volume of the solvents. After each addition, the system is vigorously shaken and examined visually for any un-dissolved solute particles. Solubility is carried out by using the following formula by UV method,
Solubility = (At/As)×Cs× (Dt/Wd×1000)
Where At is the Sample(test) absorbance
As is the Standard absorbance
Cs is the standard concentration of drug
Dt is the dilution factor
Wd is the Weight of the drug
Supersaturated solutions of Aceclofenac drug with water, 0.1N HCl, Phosphate buffer-pH6.4,Phosphate buffer-pH-6.8, Phosphate buffer-pH-7.2 were prepared and absorbance was measured at 276nm
Pre-Compression Evaluation Parameters
Bulk density-Bulk density of a powder is the ratio of mass of the powder to the Bulk volume. Bulk density is an important parameter in pharmaceutical and powder processing industries as it provides insight into the flow and packing properties of the powder. It was determined by specified amount of pouring powder sample through a graduated cylinder and to measure the volume. Bulk density was measured by using formula
P = m/Vo
Where, P = Bulk density m = Mass of the Powder Vo= Untapped Volume
Tapped Density- It provides information on the volume occupied by the powder after compaction through tapping.
Pt = m/Vi
Where, Pt = Tapped density m = Mass of the powder Vi= Tapped volume
Carr’s compressibility Index-Compressibility is the ability of powder to decrease in volume under pressure. Using untapped density and tapped density the percentage compressibility of powder was determined, which was given as Carr’s compressibility index.
CI = Vi-V0 / Vi × 100
Where, CI = Compressibility index Vo = Bulk density Vi = Tapped density
Hausner Ratio-It is the measurement of frictional resistance of the drug. It was determined by the ratio of tapped density and bulk density. Hausner Ratio was measured by using formula,
Hausner Ratio = Vi/ Vo
Where, Vo = Bulk density Vi = Tapped density
Angle of repose (θ)-It is the maximum angle obtained between the free-standing surface of the powder heap and the horizontal plane. It is a characteristic related to the inter particulate friction or resistance to movement between particles.
Angle of repose was measured by using fixed height funnel method. The method used to find the angle of response is to pour the powder in the form of a conical heap on a flat surface and measure the inclined angled with the horizontal pile.
tan θ = h / r
θ = tan-1 (h / r)
Where, h = height of pile, r = radius of the base of the pile, θ = angle of repose
The lower the angle of repose, the better the flow property.
Rough and irregular surface of particles gives higher angle of repose.
Decreased in the particle size leads to a higher angle of repose.
Procedure-Weighed quantity of Powder was passed through a funnel kept at a height of 2 cm for the base. The powder is passed till it forms heap and touches the tip of the funnel. The radius was measured and angle of repose was calculated by using the above-mentioned formula.
Table 1
Flow properties and corresponding angle of repose, compressibility index, Hausner ratio
Drug Excipient Compatibility Studies
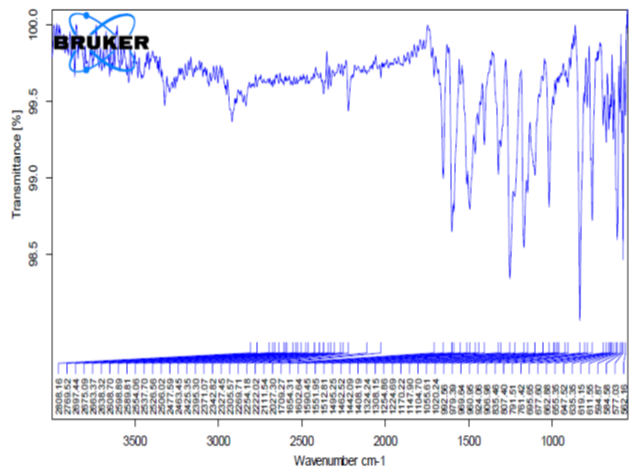
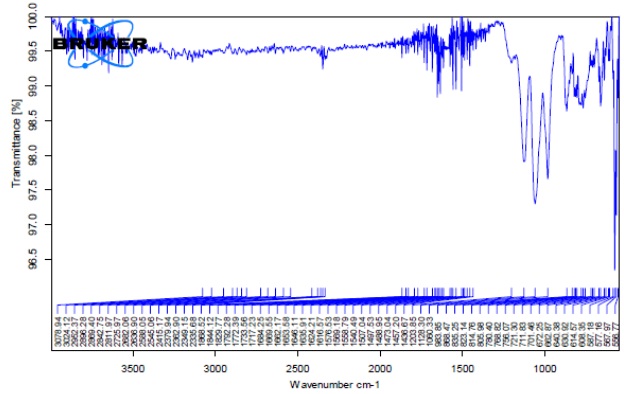
Fourier transform infrared spectroscopy (FT-IR)
The objective of drug/excipient compatibility possible interactions between formulation containing excipients and API. Homogenous mixtures of drug and excipients were prepared and filled in glass vials. Samples packed in glass vials were maintained at 60± 2°C for 2 weeks
Potassium bromide was mixed with drug and/or polymer in 9:1 ratio and the spectra were taken. FT-IR spectrum of Aceclofenac was compared with FT-IR spectrum of Aceclofenac with polymer/excipients. Disappearance of Aceclofenac peaks or shifting of peaks in any of the spectra was studied.
Calibration Curve of Aceclofenac
Standard stock solution preparation
Accurately weighed 100 mg of drug (Aceclofenac) was first dissolved 100 ml of Phosphate buffer at pH- 6.8 in 100 ml of volumetric flask and to make a concentration of 1000 μg/ml (Primary stock solution). From the primary stock solution to make a concentration of 100μg/ml (secondary stock solution).
Formulation and Development of Aceclofenac Fast Disintegrating Tablets by using Direct Compression method
Step 1: All the ingredients- Aceclofenac, Disintegrating agent, Sida acuta and lactose have been weighed individually into separate poly bags.
Step 2: These ingredients are then sifted through sieve no. 40 and blended together in a poly bag for 10 min.
Step 3: Lubrication-Weighed amount Magnesium Stearate sieved through mesh sieve no. 60 were added to the above blend and blending was carried out for 5 more min.
Step 4: Compression-The lubricated blend is compressed using punch toolings.
Upper punch: Plain Lower punch: Plain.
Step 5: Description of core tablets: White and Oblong biconvex tablet plain on both sides.
In-vitro Evaluation Tests for Aceclofenac Fast Disintegrating Tablets 10, 11, 12, 13, 14, 15, 16, 17, 18
General appearance-The formulated tablets were assessed for its general appearance and observations were made for shape, colour, texture and odour.
Thickness-Thickness of the tablets was measured by using Digital Vernier Callipers.
Desired thickness: 2.0 - 4.0 mm
Hardness-Hardness of the tablet is defined as the force required in breaking a tablet.In this test a tablet was placed between two anvils, force was applied to the anvils and the crushing strength that just causes the tablet to break is recorded. Hence hardness is sometimes referred to as Crushing Strength.
Tablets require certain amount of strength or hardness to with stand mechanical shocks of handling in manufacture, packaging and shipping. At a constant compression force (fixed distance between upper and lower punches), hardness increases with increasing die fills and decreases with lower die fills.
Desired hardness: 4-12 Kg/cm2
Friability-Friability is defined as the loss in weight of tablet in the container due to removal of fine particle from their surface. It is expressed in percentage (%). A pre weighed tablet sample (20 tablets) was placed in the friabilator chamber and rotated for 10 revolutions. In each revolution the tablets are carried up and are allowed to freely fall from a height of 6 inches. After 100 revolutions the tablets are removed from the chamber and reweighed.
% Friability was then calculated using the following formula:
Friability = [(Initial wt – Final wt)/ Initial wt] X 100
Limit: Friability should be less than 1%
Weight Variation- Individually weighed 20 tablets and calculate the average weight not more than two of the individual weights deviate from the average weight by more than the percentage deviation shown in Table 3 and more deviated by more than twice that percentage.
Table 3
Limits for weight variation
|
Average weight of Tablets (mg) |
Maximum Percentage deviation (%) |
|
|
IP |
USP |
|
|
130 or less |
80 or less |
10 |
|
130 – 324 |
80-250 |
7.5 |
|
324 or more |
250 or more |
5.0 |
Disintegration Test-The process of breakdown a tablet into smaller particles is called as disintegration and it was determined by using disintegration test apparatus.
Place one tablet in each of the 6 tubes of the basket. Add a disc to each tube and run the apparatus using water,0.1 N HCl or Phosphate buffer PH 6.8 as the immersion liquid and maintained a temperature at 37o± 2 oc. The time taken for complete disintegration of the tablet with no palpable mass remaining in the apparatus was measured and recorded.
Content uniformity- Weigh and powder 20 tablets. Weigh accurately a quantity of the powder equivalent to 50mg of Aceclofenac, shake with 60ml of methanol in a 200ml clean, dry volumetric flask and dilute to volume with methanol and sonicate for 30 minutes at room temperature. Dilute 5ml of this solution to 100ml with methanol and centrifuge the solution at 10,000 RPM for 10 minutes. Filter through 0.45µ nylon membrane filter and to measure absorbance at 276nm.
Assay = (At/As) ×Cs× (Dt/Wd) ×100
Where At is the Sample(test) absorbance.
As is the Standard absorbance.
Cs is the standard concentration of drug.
Dt is the dilution factor.
Wd is the Weight of the drug.
Wetting Time-This test was used to measure the time required for complete wetting of tablet. A piece of tissue paper folded twice was placed in small Petri dish containing 10ml of water with amaranth, a water-soluble dye was added. A tablet was placed on this paper. The time required for water to reach the upper surface of the tablet was noted as wetting time.
In-Vitro Drug Release Study
Preparation of dissolution medium (Phosphate buffer PH- 6.8)
Dissolve 28.80gm of Disodium hydrogen phosphate and 11.45gm of Potassium dihydrogen phosphate dissolved in 1Lt of distilled water and sonicated for 10-15 min. The drug release was determined using United States Pharmacopeia (USP) dissolution testing apparatus type II (paddle method) with 900 ml of Phosphate buffer pH- 6.8, at 370± 0.50 C and 50 rpm. In specified time intervals an aliquot of 5ml samples of the solution were withdrawn from the dissolution apparatus and replacement of fresh fluid to dissolution medium. The samples were filtered through filter paper of 0.45 μ m and to measure the absorbance at 276 nm using by using UV/Visible Spectrophotometer.
The % drug release of the formulation can be calculated by
% drug release = (At/As) ×Cs× (Dt ×Vm/Wd×1000) ×100
Where At is the Sample(test) absorbance.
As is the Standard absorbance.
Cs is the standard concentration of drug.
Dt is the dilution factor.
Wdis the Weight of the drug.
Is the Volume of the Dissolution MediumTable 4
Table 4
Dissolution parameters
In-Vitro Release Kinetics Studies
The analysis of drug release mechanism from a pharmaceutical dosage form and order of drug release from fast disintegrating tablets was described by using zero order kinetics or first order kinetics.
Zero Order Release Kinetics
It defines a linear relationship between the fractions of drug released versus time.
Q=ko t.
Where, Q is the fraction of drug released at time t.
Ko is the zero-order release rate constant.
A plot of the fraction of % of drug released against time (Min) will be linear if the release obeys zero order release kinetics.
First order release kinetics
Wagner assuming that the exposed surface area of a tablet decreased exponentially with time during dissolution process suggested that the drug release from most of the slow-release tablets could be described adequately by the first-order kinetics. The equation that describes first order kinetics is
Log C= Log C0-kt/2.303
Where C is the amount of drug dissolved at time t,
Co is the amount of drug dissolved at t=0 and
Method for comparison of Dissolution Profile19
A model-independent method for comparison of two dissolution profiles is based on determination of difference factor f1 and similarity factor f2 which are calculated using the formula
Where n = Number of dissolution time points
Rt = Dissolution value of the reference drug product at time t
Tt = Dissolution value of the test drug product at time t
Solubility Analysis
Table 7
Solubility analysis of Aceclofenac with different solvents
|
S.No |
Type of solvent |
Solubility(mg/ml) |
|
1 |
Water |
0.069±0.018 |
|
2 |
0.1N Hcl |
0.650±0.009 |
|
3 |
Phosphate buffer pH-6.4 |
0.910±0.022 |
|
4 |
Phosphate buffer pH-6.8 |
0.985±0.550 |
|
5 |
Phosphate buffer pH-7.2 |
0.929±0.033 |
Table 8
Standard calibration curve data of aceclofenac
|
S. No |
Concentration (µg/ml) |
Absorbance |
|
1 |
0 |
0 |
|
2 |
2 |
0.142±0.018 |
|
3 |
4 |
0.282±0.003 |
|
4 |
6 |
0.420±0.016 |
|
5 |
8 |
0.556±0.025 |
|
6 |
10 |
0.692±0.021 |
Table 9
Evaluation of flow properties of blends of various trial batches of aceclofenac
Table 10
Post compression tests of Aceclofenac FD tablets
Table 11
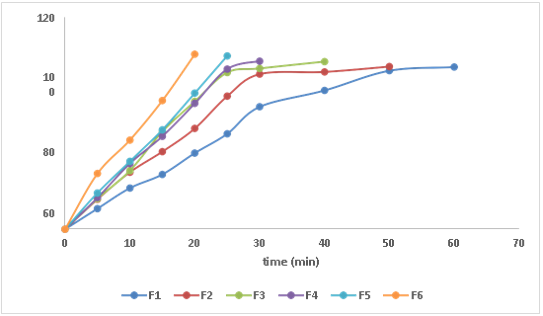
Dissolution profiles of formulations (F1 to F6)
Summary and Conclusion
The present study was to formulate and in-vitro evaluation of Aceclofenac by using Sida acuta powder by using different formulations of various concentrations. The powder blend prepared as formulations for various physical parameters such as bulk density, Tapped density, Compressibility index, Hausner's ratio, Angle of repose. So, the values were found to be within the limits. All formulations were evaluated for Assay results, Hardness, Friability, Weight variation, Thickness, Disintegration time and Wetting time fell within acceptable limits which indicated the uniformity, strength and stability of formulated tablets. As the ratio of polymer increased then the Disintegration time was decreased. Among all the 6 formulations the"F6" formulation [Aceclofenac- sida acuta] showed better drug release when compared to other formulations. In-Vitro dissolution studies showed 99.75% of drug release within 20 minutes and the mechanism of drug release from the FDT release was followed to be First order kinetics.
The release profile of optimized formulation (F6) among all the formulations the selected powder act as fast disintegrating agent.
The study successfully formulated Aceclofenac tablets using Sida acuta powder, with F6 demonstrated excellent drug release profile. Sida acuta powder acted as an effective fast-disintegrating agent, contributing to rapid disintegration and dissolution of the tablets. Increasing Sida acuta concentration led to decreased disintegration time and increased dissolution rate, suggesting its role as a fast-disintegrating agent in the formulation.


