Introduction
Cilnidipine protects the end organs from the potentially damaging consequences that hypertension might have. The elderly, diabetics, and albuminurics are three groups of persons who can benefit from consuming it. Cilnidipine is being used by an increasing number of patients who are afflicted with chronic renal disease. High blood pressure is also referred to as hypertension in some circles. The force that is generated when the blood that is pumped by the heart presses against the walls of the blood vessels is referred to as blood pressure. A disorder that can cause irreversible damage to the blood vessels is high blood pressure, which is also known as hypertension. Bisoprolol is prescribed to patients with hypertension that is either mild or severe in severity. Treatment of illnesses such as heart failure, atrial fibrillation, and angina pectoris are examples of off-label usage of a drug.1 The combination of these two drugs Cilnidipine and Bisoprolol is used in the treatment of Hypertension (high blood pressure). Cilnidipine and bisoprolol lower blood pressure effectively. Several analytical methods are available which can determine individually or in combination with another drug. From detailed review of literature, it was found that no analytical method is available for determination of this combination and its degradants from simulated mixture or formulation. So, for the same reason stability indicating RP — HPLC method was selected.2, 3, 4, 5, 6, 7
Materials and Methods
CIL (99.98% pure) and BIS (99.96% pure) were obtained as gift sample for research purpose from, Cadila Healthcare Ltd., Sanand. Acetonitrile (HPLC grade), Orthophosphoric acid (LR grade) was purchase from S. D. fines.
Preparation of stock solution
BIS: Accurately weighed 5 milligram drug dissolved in 100 millilitre methyl alcohol (50 μg/millilitre). 1.0 millilitre from Stock Solution and make up to 10millilitre with mobile phase (5 μg/millilitre).
CIL: Accurately weighed 10 milligram drug dissolved in 100 millilitre methyl alcohol (100 μg/millilitre). 1.0 millilitre from Stock Solution and make up to 10millilitre with mobile phase (10 μg/millilitre).8
Selection of analytical wavelength
Working standards of BIS (10 µg/millilitre) and CIL (10 µg/millilitre) were scanned in UV 200 – 400 nanometer region and overlapped.9, 10, 11, 12, 13, 14, 15
Table 1
Preparation of solution for accuracy studies
Table 2
System suitability parameter of CIL and BIS
Table 3
Evaluation table of forced degradation studies
Table 4
Linearity data of CIL
|
Sr. No. |
Conc. (µg/millilitre) |
Mean |
± SD (n=3) |
RSD |
|
1 |
5 |
206751.4 |
7778.06 |
1.76 |
|
2 |
10 |
421172.6 |
6989.08 |
1.66 |
|
3 |
15 |
637635.2 |
3544.88 |
0.56 |
|
4 |
20 |
822667.2 |
7669.76 |
0.93 |
|
5 |
25 |
992189 |
4990.28 |
0.51 |
Table 5
Linearity data of BIS
|
Sr. No. |
Conc. (µg/millilitre) |
Mean |
± SD (n=3) |
RSD |
|
1 |
2.5 |
196331.2 |
3558.13 |
1.81 |
|
2 |
5 |
307226.8 |
3120.45 |
1.02 |
|
3 |
7.5 |
438759.4 |
6720.61 |
1.53 |
|
4 |
10 |
561795.6 |
6669.63 |
1.19 |
|
5 |
12.5 |
660774.4 |
6020.37 |
0.91 |
Table 6
Repeatability data of CIL
Table 7
Repeatability data of BIS
Table 8
Intraday andinterday precision data of CIL
Table 9
Intraday andinterday precision data of BIS
Table 10
Accuracy data of CIL by HPLC method
Table 11
Accuracy data of BIS by HPLC method
Preparation of Solutions for Forced Degradation Studies
Acid induced hydrolysis
Accurately weighed amount corresponding to 10 mg of CIL and 5 mg of BIS were transferred to 10 ml volumetric flask and add 5 mL of 1 N HCl. Same solution was heated under reflux condition at 60°C for 1 hour on a hot plate. After the heating cool down the solution and were neutralized with 2 N NaOH and volume was raised to mark with diluent if necessary. 0.1 mL of previous solution was further diluted to 10 mL with diluent. The resulting solution have concentration of 10 µg/mL of CIL and 5 µg/mL of BIS (Treated sample). In similar way 0-hour sample (Only difference was heating condition was not provided) and blank (Only difference is there is no addition of API) were prepared. % Degradation of both components was calculated by comparing area of treated sample and control.16
Base induced hydrolysis
Same amount of API like in former case were transferred to 10 mL volumetric flask and volume of same was raised to the mark with 5 mL 1 N NaOH. Same solution was heated under reflux condition at 60°C for 1 hour on a hot plate. After the heating cool down the solution and were neutralized with 2 N HCl and volume was raised to mark with diluent if necessary. 0.1 ml of previous solution was further diluted to 10 mL with diluent. The resulting solution have concentration of 10 µg/mL of CIL and 5 µg/mL of BIS (Treated sample). In similar way 0-hour sample and blank sample were prepared. % Degradation of both components was calculated by comparing area of treated sample and control.16
Hydrogen peroxide induced stress (Oxidative)
Same amount of API like in former case were transferred to 10 mL volumetric flask and volume of same was raised to the mark with 5 mL 3% hydrogen peroxide. Same solution was heated under reflux condition at 60°C for 1 hour on a hot plate. After the heating cool down the solution and volume was raised to mark with diluent. 0.1 ml of previous solution was further diluted to 10 mL with diluent. The resulting solution have concentration of 10 µg/mL of CIL and 5 µg/mL of BIS (Treated sample). In similar way 0-hour sample and blank sample were prepared. % Degradation of both components was calculated by comparing area of treated sample and control.16
Thermal stress
Exact quantity of CIL and BIS like in previous cases were transferred to petri dish and exposed to 70 C° for 3 hours in hot air oven and residues were reconstituted with help of acetonitrile and transferred into 10 mL volumetric flask and volume of flask was raised with the mark with same solvent. 0.1 mL of resulting solution was further diluted to 10 ml with diluent. Above solution was chromatographed and % degradation was computed by comparing against standard concentration of CIL and BIS.16
Preparation of Solutions for Analytical Method Validation
Linearity and range
Preparation of CIL (25 to 400 µg/millilitre) and BIS (4 to 64 µg/millilitre). Master Stock Solution: 5 milligram CIL and 2.5 milligram BIS dissolved in 10 millilitre MeOH. Concentration of master stock solution (µg/millilitre) CIL+BIS (500+250) µg/millilitre. Volume of master stock solution (millilitre) 0.1 – 0.5. Final dilution in 10 millilitre volumetric flask. Volume make up was done with mobile phase. Concentration of final mixture (in µg/millilitre) 5+2.5 - 25+12.5. All above solutions were injected at volume of 20 µL into column by employing optimized chromatographic conditions.17, 18, 19, 20
Intermediate precision (Repeatability)
Prepared standard mixtures having concentration of CIL (5 µg/millilitre to 25 µg/millilitre) and BIS (2.5 µg/millilitre to 12.5 µg/millilitre) were injected at volume of 20 µL into column by employing optimized chromatographic conditions. Each standard mixture was injected 5 time and peak area was monitored. Each concentration was monitored for repeatability by RSD.17, 18, 19, 20
Accuracy
Accuracy of the analytical method has been performed by spiking of placebo with the standard. Placebo for the study was selected on the basis of reported formulation. And spiking of the placebo was performed at 50, 100 and 150 % of the target concentration. (Table 1)17, 18, 19, 20
Assay
Sample Preparation: Composition of Synthetic Mixture: Composition of Placebo: HPMC (4 milligram), MCC (190 milligram), Magnesium stearate (4 milligram), Talc (2 milligram). Role of HPLC-Film forming agent, MCC- Directly compressible material, MS, gliding agent, Talk, lubricating agent CIL (10 milligram) and BIS (5 milligram) was taken into the volumetric flask (100 millilitre) and volume of the flask was raised to 100 milliliters with acetonitrile to give stock solution containing 100 µg/millilitre of CIL and 50 µg/millilitre of BIS. (Sonicate the solution for 10 minutes and filter the same from 0.45 Micro-meter Whatman filter paper.).
Test Solution: Withdraw 1.0 millilitre from above filtrate in 10 millilitre volumetric flask; make up the volume with mobile phase, which contain CIL+BIS = 10+5 µg/millilitre.17, 18, 19, 20
Result and Discussion
Selection of analytical wavelength
Working standard of Metoprolol and Bisoprolol fumarate were scanned in UV range of 200 – 400 nm and overlapped Two iso-absorptive points were observed that is 240 nm and 254 nm (Figure 1). Therefore, 245 nm was selected as analytical wavelength for further trials. As well as both the compounds gives good intensity peak at 245 nm.
Optimized chromatographic condition
When method was operated using optimized chromatographic condition a well resolved peak of CIL and BIS was observed at 3.281 and 15.114 minutes respectively (Figure 2). All the system suitability parameters were within the guidelines.
Forced degradation studies
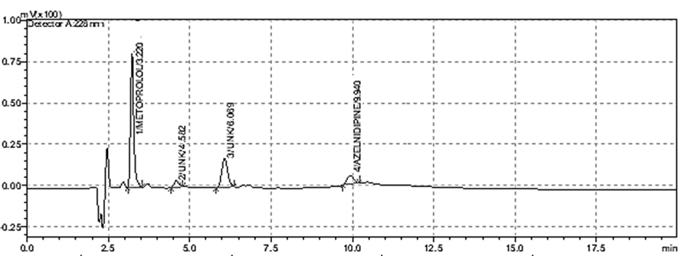
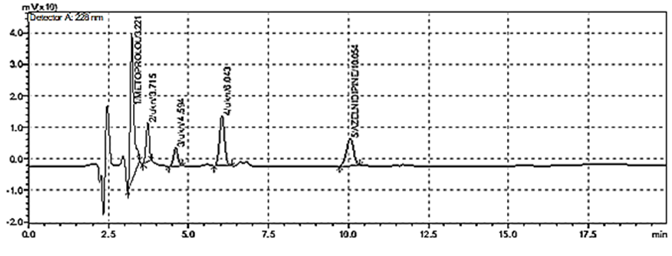
Optimized method was found to be stability indicating as it is able to separate all the degradation products in the presence of active ingredient. (Figure 3, Figure 4, Figure 5, Figure 6) No degradation product found to interfere with estimation of CIL and BIS in stressed samples. Even the stress given found to be optimum as % degradation observed was predictive in nature (below 15%). (Table 3)
Analytical Method Validation
Linearity and range
As per ICH guidelines, the value of r2 should be greater than 0.995 and observed r2 for given concentration range for CIL and BIS is 0.998 and 0.9993 respectively. Hence, we can say that developed method is linear over the range of 5 – 25 µg/mL and 2.5 – 12.5 µg/mL for CIL and BIS respectively show in Figure 7, Figure 8. Linearity data for both drugs is shown in Table 4, Table 5.
Repeatability
When all mixtures were analyzed at all concentration, calculated relative standard deviation at each level was found to be less than 2 so that method was found to be repeatable over the range of 5 – 25 µg/mL and 2.5 – 12.5 µg/mL for CIL and BIS respectively. Repeatability data are shown in Table 6, Table 7 for CIL and BIS respectively.
Method precision
For determining inter day and intraday precision, % RSD was monitored at selected concentration level which was found to be less than 2 so method was found to be precise for estimation of CIL and BIS. Data for intermediate precision are given in Table 8 and 9 for CIL and BIS respectively.
Accuracy study
Accuracy of the analytical method has been performed by spiking of placebo with the standard. Placebo for the study was selected on the basis of reported formulation. And spiking of the placebo was performed at 50, 100 and 150 % of the target concentration. (Table 10, Table 11).
Assay
When prepared synthetic mixture was analyzed by developed and validated method, % assay was found to be 101.4 for CIL and for 101.2 BIS (Table 12).
Acknowledgment
The authors are thankful to RMS Scientific services, Anand Gujarat, India for scientific consultation.
Author Contribution
Pramod Kumar Goyal, Research Scholar. Maharishi Arvind University, Jaipur.
Dr Manish Jaimini, Professor & Principal, Dept of Pharmacy, Maharishi Arvind University, Jaipur.
Dr Piush Sharma, Professor & Principal, Maharishi Arvind College of Pharmacy, Jaipur.
Mohit Agarwal, Assistant Professor, NIMS Institute of Pharmacy, NIMS University, Jaipur.


