Introduction
When we discuss about aspirin (ASP), it is chemically acetyl derivative of benzoic acid having wide spectrum of physiological action that includes anti-inflammatory, analgesic and direct platelet aggregation inhibitory action. Previous actions are mediated through inhibition of cyclooxygenase pathways.1 Currently it is having legal status in Indian Pharmacopeia (IP), British Pharmacopeia (BP) and United State Pharmacopeia (USP). Extensive literature search highlights majorly UV spectroscopy,2, 3, 4, 5 HPLC6, 7, 8 and HPTLC9, 10, 11 as analytical methods for analysis of Aspirin from bulk and pharmaceutical dosage form.
On contrast, pantoprazole sodium (PAN) is benzimidazole derivative which preliminary decrease the gastric acid secretion by supressing Na+/K+ ATP pump that is again having legal status in Indian Pharmacopeia (IP) and United State Pharmacopeia (USP).12 Detailed literature review revealed UV,13, 14, 15, 16 HPLC17, 18 and HPTLC 19, 20, 21 method for determination of Pantoprazole sodium in bulk and pharmaceutical dosage form.
At present, the proposed combination of pantoprazole sodium and aspirin is in clinical phase III and trials have been initiated by Alkem laboratories at clinical dose level of 20 mg and 80 mg respectively and it has been rationalized that co-administration of pantoprazole sodium enhances antiplatelet aggregation activity and decrease associated gastrointestinal complication like ulcers.
At present there is no analytical method available for determination of Aspirin and pantoprazole and hence it was decided to develop and validate a new, simple, precise and accurate, stability indicating RP-HPLC method for determination of ASP and PAN in synthetic mixture. Simulated mixture, which actually resembles to the formulation was used, as commercial formulation is not available in the market because of phase III trial (i.e., encapsulation of all contents in the hard gelatine capsules in required proportion). The dose of Pantoprazole and Aspirin was decided as per disclosure made in clinical trail initiated by Alkem laboratories.22
Materials and Methods
Materials
Both active components ASP (99.46% w/w) and PAN (99.67% w/w) were received as gift samples from to RMS Scientific services, Anand Gujarat. while other solvents like methyl alcohol and water were of HPLC grade and procured from Merck life sciences private limited, Mumbai. Hard gelatin shells were procured purchased from shashwat herbal, Anand, Gujarat. Inactive agents used in the study are selected as per IIG limits and were available at the institute level. Other chemicals like hydrogen peroxide, HCl and NaOH were also available at institute level.
Instrument and experimental conditions
Shimadzu 20ATVp HPLC unit equipped with autosampler having provision of UV-VIS detector and capable of quaternary gradient operation was used to process the samples, while LC Solution® sofftware was used to process and integrate the obtained chromatogram. Hypersil ODS C18 column (250 x 4.6 mm, 5μ) was employed as analytical column. Mettler Toledo weighing balance was used to weigh accurate quantities of samples having sensitivity of 0.1 mg. All the solutions were sonicated by using sonicator having make of Labtronik.
Optimization of chromatographic conditions
For optimizing separation, initially working solutions of ASP and PAN were prepared at concentration of 10 µg/ml in methyl alcohol owning to similar solubility in that solvent. For method development purpose 254 nm was selected as analytical wavelength as both the components possess significant absorbance at that wavelength. When the components were handled on Hypersil ODS C18 column (250 x 4.6 mm, 5μ) as the separation phase and combination of methyl alcohol and water in ratio of 70: 30 on volume basis as the elution medium at flow rate of 0.8 ml/minute, well resolved peak of both the actives were observed. So, for this purpose isocratic mode on former conditions was preferred. All the system suitability parameters (SSTs) were observed on above mentioned chromatographic condition.
System Suitability Parameters
The applicability of optimized condition was further assessed by system suitability testing. The same was executed by chromatographing standard mixture having concentration of 24+6 µg/ml of ASP and PAN for five times and parameters like resolution (Rs), elution time (Tr), number of theoretical plates (N) and tailing factor (T) were monitored with associated relative standard deviation.
Preparation of Solutions for Forced Degradation Studies
Acid induced hydrolysis
Accurately weighed amount corresponding to 80 mg of ASP and 20 mg of PAN were transferred to 50 ml volumetric flask and volume of same was raised to the mark with 50 ml 0.1 N HCl. Same solution was heated under refluxed condition at 80°C for 1 hour. After any loss was compensated by addition of 0.1 N HCl. 1.5 ml of previously cooled solution was transferred to 10 ml volumetric flask and 5 ml diluent (mobile phase) was added. The same contents were neutralized with 1 M NaOH and volume was raised to mark with diluent. 1 ml of previous solution was further diluted to 10 ml with diluent. The resulting solution have concentration of 24 µg/ml of ASP and 6 µg/ml of PAN (Treated sample). In similar way 0 hour sample (Only difference was heating condition was not provided) and blank (Only difference is there is no addition of API) were prepared. % Degradation of both components was calculated by comparing area of treated sample and control.
Base induced hydrolysis
Same amount of API like in former case were transferred to 50 ml volumetric flask and volume of same was raised to the mark with 50 ml 0.1 N NaOH. Same solution was heated under refluxed condition at 80°C for 1 hour. After any loss was compensated by addition of 0.1 N HCl. 1.5 ml of previously cooled solution was transferred to 10 ml volumetric flask and 5 ml diluent (mobile phase) was added. The same contents were neutralized with 1 M HCl and volume was raised to mark with diluent. 1 ml of previous solution was further diluted to 10 ml with diluent. The resulting solution have concentration of 24 µg/ml of ASP and 6 µg/ml of PAN (Treated sample). In similar way 0 hour and blank sample were prepared. % Degradation of both components was computed by comparing area of treated sample and control.
Hydrogen peroxide induced stress (Oxidative)
Same amount like in acid and base hydrolysis were subjected to oxidative stress by exposing them to 50 ml of 1% H2O2 and the contents were refluxed at 80°C for 1 hour. 1.5 ml of previously cooled solution was transferred to 10 ml volumetric flask and 5 ml diluent was added. 1 ml of previous solution was further diluted to 10 ml with diluent. In similar way 0 hour and blank sample were prepared. % Degradation of both components was computed by comparing area of treated sample and control.
Thermal stress
Exact quantity of ASP and PAN like in previous cases were transferred to petri dish and exposed to 80 C° for 3 hours in hot air oven and residues were reconstituted with help of methyl alcohol and transferred into 50 mL volumetric flask and volume of flask was raised with the mark with same solvent. 1.5 ml of resulting solution was diluted to 10 ml with diluent and 1 ml of resulting solution was further diluted to 10 ml with diluent. Above solution was chromatographed and % degradation was computed by comparing against standard concentration of PAN and ASP.
Preparation of Solutions for Analytical Method Validation
Preparation of solution for linearity and range
To study linearity and range, accurately weighed quantities of 20 mg PAN and 80 mg ASP was diluted to 100 ml with diluent to produce stock solution containing 200 µg/ml PAN and 800 µg/ml of ASP. Various aliquotes were transferred to 10 ml volumetric flask and volume of each raised to 10 ml to give mixtures having concentration of 8-40 µg/ml to 2-10 µg/ml of ASP and PAN respectively. Each concentration was injected at 20 µl injector volume and response obtained was plotted against concentration to observe linear regression coefficient.
Intermediate precision (Repeatability)
For adjudging repeatability of method, solution of linearity studies were analyzed 5 times and each level is observed for relative standard deviation (RSD).
Method precision
This parameter was studies by injecting individual concentration that represents overall range are studies on same day and between days and for the same Mixture of ASP and PAN that represents overall range (8+2,16+4 and 24+6 µg/ml) were analyzed on same day at different time interval for Intraday precision and different day for Interday precision. Each concentration was analyzed for three times and was monitored for RSD at each level.
Accuracy study
As it refers to the % recovery of analyte in presence of excipients, it was practiced by spiking of placebo with standard at 50, 100 and 150% of target concentration. Each concentration was injected for three times and % recovery was calculated on the basis of served area at each spiking level (By utilization of linear regression analysis). Composition of placebo: Microcrystalline cellulose (30mg), Eudragit (25mg), Polyethylene Glycol (15mg), Dicalcium phosphate (40mg). (Table 1)
Assay
For the said purpose, 80 mg of ASP and 20 mg of PAN were weighed accurately and mixed with commonly used excipient (same used in accuracy study). All the contents were diluted to 100 ml with methyl alcohol, sonicated for 5 minutes and filtered from 0.45 micron membrane filter under positive pressure. 0.3 ml of previously filtered solution was further diluted to 10 ml with diluent (mobile phase) to give final concentration of 24 µg/mL of ASP and 6 µg/mL of PAN. Above solution was chromatographed in triplicates by employing optimized chromatographic conditions.
Result and Discussion
Optimized chromatographic conditions
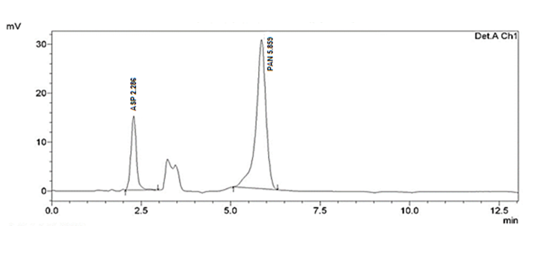
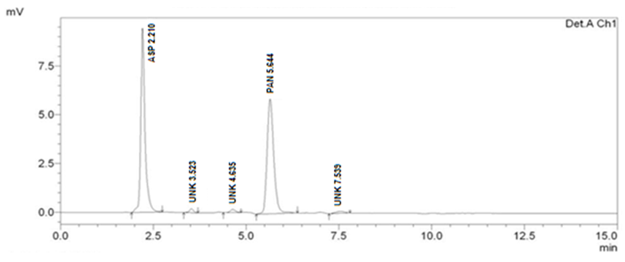
When method was operated using optimized chromatographic condition a well resolved peak of ASP and PAN was observed at 2.286 and 5.859 minutes respectively (Figure 1). All the system suitability parameters were within USP guidelines with RSD less than 1 and have been highlighted inTable 2.
Table 1
Preparation of solutions for accuracy studies
Table 2
System suitability parameters ASP + PAN = 24 + 6 µg/mL
Table 3
Summary of data derived from forced degradation study by proposed HPLC method
Table 4
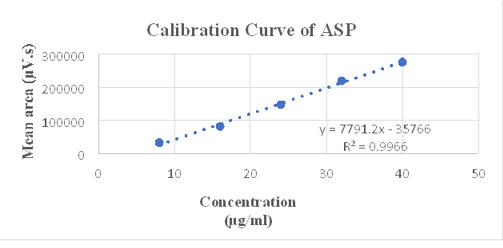
Linearity data of ASP
|
Sr. No. |
Concentration (µg/ml) |
Mean area (µV.s) ± SD |
RSD |
|
1 |
8 |
32312 ± 333.30 |
1.032 |
|
2 |
16 |
81844 ± 721.68 |
0.881 |
|
3 |
24 |
147389.4 ± 931.625 |
0.632 |
|
4 |
32 |
219374.6 ± 1003.108 |
0.457 |
|
5 |
40 |
275195.8 ± 1021.303 |
0.371 |
Table 5
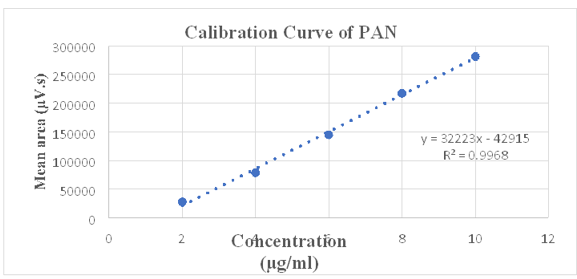
Linearity data of PAN
|
Sr. No. |
Concentration (µg/ml) |
Mean area (µV.s) ± SD |
RSD |
|
1 |
2 |
28475 ± 293.2 |
1.03 |
|
2 |
4 |
79202 ± 579.68 |
0.731 |
|
3 |
6 |
145310.2 ± 945.15 |
0.650 |
|
4 |
8 |
217634.2 ± 983.01 |
0.451 |
|
5 |
10 |
281486.8 ± 1042.89 |
0.370 |
Table 6
Repeatability data of ASP
Table 7
Repeatability data of PAN
Table 8
Intraday and inter day precision data of ASP (n = 3 determinations)
Table 9
Intraday and inter day precision data of PAN (n = 3 determinations)
Table 10
Accuracy data of ASP and PAN by HPLC method
Forced Degradation Studies
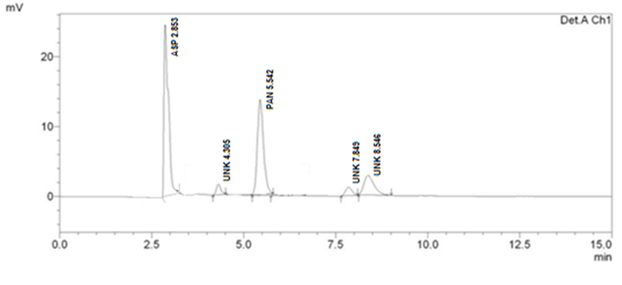
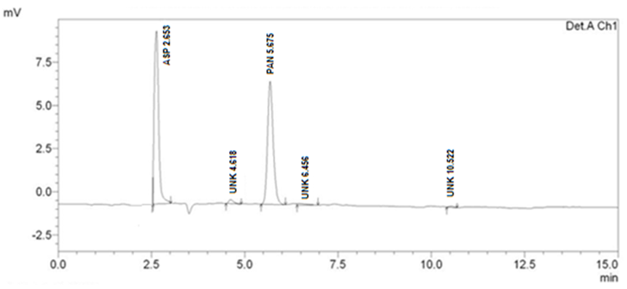
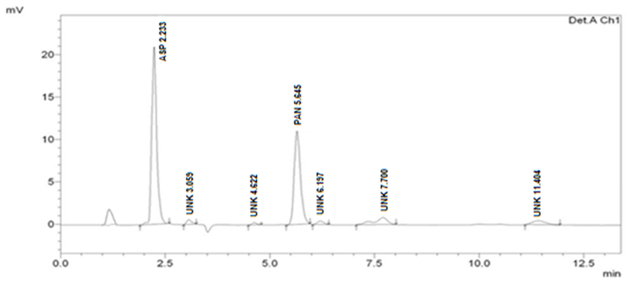
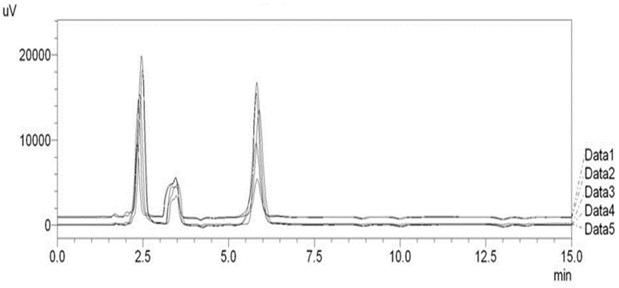
Optimized method was found to be stability indicating as it is able to separate all the degradation products in the presence of active ingredient. (Figure 2, Figure 3, Figure 4, Figure 5) No degradation product found to interfere with estimation of ASP and PAN in stressed samples. Even the stress given found to be optimum as % degradation observed was predictive in nature (below 15%). (Table 3)
Analytical Method Validation
Linearity and range
As per ICH guidelines, the value of R2 should be greater than 0.995 and observed R2 for given concentration range for ASP and PAN is 0.996 and 0.997 respectively. Hence, we can say that developed method is linear over the range of 8 - 40 µg/mL and 2 – 10 µg/mL for ASP and PAN respectively show in Figure 6, Figure 7, Figure 8. Linearity data for both drugs is shown in Table 4, Table 5.
Repeatability
When all mixtures were analyzed at all concentration, calculated relative standard deviation at each level was found to be less than 2 so that method was found to be repeatable over the range of 8 - 40 µg/mL and 2 – 10 µg/mL for ASP and PAN respectively. Repeatability data are shown in table 6 and 7 for ASP and PAN respectively.
Method precision
For determining inter day and intraday precision, %RSD was monitored at selected concentration level which was found to be less than 2 so method was found to be precise for estimation of ASP and PAN. Data for intermediate precision are given in table 8 and 9 for ASP and PAN respectively.
Accuracy study
Spiked placebo with standard solution at 50, 100 and 150% level was analyzed for % recovery which was found within 98 to 102, so method was found to be accurate (Table 10).
Assay
When prepared synthetic mixture was analyzed by developed and validated method, % assay was found to be 99.435 for ASP and for 99.416 PAN (Table 1)
Summary and Conclusion
As the proposed combination of ASP and PAN is in clinical phase III, no analytical method is available yet for simultaneous quantitative expression of both the components from synthetic mixture. The proposed stability indicating RP-HPLC method not only separates and quantify the components from synthetic mixture with at most accuracy but also gives idea about the stability of mentioned components under variety of conditions as per ICHQ1 guidelines. It can be concluded that both the components are highly susceptible to oxidative stress (10.44 for ASP and 15.62 for PAN) and hence formulation of both can me made and packaging can be made in such a way that it can be protected from exposure to atmospheric oxygen. Finally, method was successfully validated as per ICHQ2R1 guidelines and applied for determination of ASP and PAN from synthetic mixture. Still there is scope of improvement in method as there is limitation of working with UV-VIS detector and hence limitation of not having peak purity is major drawback with stability indicating method.
Acknowledgment
The authors are thankful to RMS Scientific services, Anand Gujarat, India for given gift sample (API) for the development of the method. We are also thankful to overall research team who have contributed in either of the way. The authors are also grateful to Smt. S.M. Shah Pharmacy College for providing excellent research facilities and promoting research activities.
Author Contributions
Preeti Yadav: Collection of all the data after the completion of the research work and the preparation of manuscript was done by Preeti Yadav.
Pinak Patel: The design of the study from choosing the drug to choosing the method was done by Pinak Patel. Protocol for execution of validation parameters and stability studies was also prepared by Pinak Patel.
Anamika Singh: Execution of Stability studies as per the protocol was done by Anamika Singh.
Rashmi Shukla: Execution of validation studies as per the protocol was done by Rashmi Shukla.
Krunal Detholia: During the study, synthetic mixture preparation according to the dose of the drugs was done by Krunal Detholia.

