Introduction
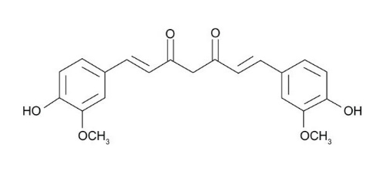
Curcumin is the principal active ingredient extracted from the rhizome of turmeric (Curcuma Longa Linn.). The plant is native to India and belongs to Zingiberaceae family.1, 2 It is very popular in China as medicinal agent to cure a number of ailments. It has a widespread occurrence in the tropical areas of Asia, Africa and Australia.3, 4 Commercially available curcumin consists of a mixture of naturally occurring curcuminoids with curcumin as major constituents (50-60%) followed by desmethoxycurcumin and bisdemethoxycucumin (2-7%).5 Chemically, curcumin is 1,7-bis-(4-hydroxy-3-methoxyphenyl)-hepta-1,6-diene-3,5-dione diferuloylmethane (Figure 1). Curcumin is the main component responsible for most of the therapeutic effects.6, 7, 8, 9 It shows antioxidant,10 antimutagenic, anti-inflammatory, anti HIV properties.11, 12, 13, 14 Unfortunately, the clinical application of curcumin is limited due to poor aqueous solubility and physiological instability. It undergoes degradation in gastrointestinal tract at different pH conditions. Literature survey revealed that no method has been reported for determination of curcumin in nanogel formulation. The aim of the research work is to develop a simple cost effective UV spectroscopic method for determination of curcumin in bulk drug and nanogel formulation. Further, the developed method has been applied for degradation kinetics study of free curcumin and nanogel formulation in different pH solutions.
Materials and Methods
Material
Curcumin was obtained as a gift sample from Loba chemicals, Banglore, India. Methanol was purchased from Merck India Ltd. Other chemicals used were in the grade of analytical reagent category.
Preparation of phosphate buffer solution
13.872 g of potassium dihydrogen phosphate and 35.084 g of disodium hydrogen phosphate was dissolved in sufficient water to produce 1 L (PBS, pH 6.8). 2.38 g of disodium hydrogen phosphate, 0.19 g of potassium dihydrogen phosphate and 8.0 g of sodium chloride was dissolved in sufficient water to produce 1 L (PBS, pH 7.4). 2.0 g of sodium chloride was dissolved in water. 7 mL of hydrochloric acid was added into it and the volume was diluted to 1 L (PBS, pH 1.2).
Table 1
Concentration and absorbance for standard curve of curcumin.
|
Concentration (μg mL-1) |
Mean absorbance (± SD) |
|
1 |
0.101 ± 0.001 |
|
2 |
0.215 ± 0.003 |
|
3 |
0.328 ± 0.005 |
|
4 |
0.438 ± 0.003 |
|
5 |
0.554 ± 0.006 |
|
6 |
0.663 ± 0.005 |
|
7 |
0.786 ± 0.007 |
|
8 |
0.897 ± 0.009 |
Table 2
Statistical data of regression equations and validation parameters.
|
Parameters |
Results |
|
Linear regression equation |
y = 0.1137x - 0.0138 |
|
Regression coefficient (r2) |
0.999 |
|
Measurement wavelength (nm) |
425 |
|
Linearity range (μg mL-1) |
1-8 |
|
LOD (μg/mL) |
0.23 |
|
LOQ (μg/mL) |
0.75 |
Table 3
Recovery of curcumin in nanogel to assess the accuracy of the proposed method.
Table 4
Precision of the method.
Table 5
Robustness of the method.
Table 6
Remaining of free curcumin and nanogel formulation.
Method validation
The method validation was carried out according to the guidance of International Chemical Harmonisation, ICH.15, 16 The parameters considered for validation of method were specificity, linearity, precision, accuracy as recovery, and robustness. The limits of detection (LOD) and quantification (LOQ) were determined using this method. All the experiments were performed at a temperature of 25°C and 60% relative humidity except robustness of the method.
Specificity
A stock solution (50 mg mL-1) of curcumin was prepared by dissolving 500 mg of curcumin in 10 mL of methanol. The stock solution was again diluted with methanol to get working solution (1 mg mL-1). A serial dilution of working solution was achieved to get different solutions in the concentration ranges of 1-8 µg mL-1 (1, 2, 3, 4, 5, 6, 7 and 8 µg mL-1). Then, UV-spectra was taken for all the samples of different concentrations to get maximum wavelength of absorptivity (λmax). The specificity of the method was evaluated by comparing the UV spectra of blank sample against standard solution of curcumin. Scanning was performed in the wavelength range of 400-800 nm. The scanning was also performed for nanogel formulation for any change in absorbance at this wavelength.
Linearity
The linearity of the method was determined at above concentration levels (1-8 µg mL-1). The absorbance of each sample was taken in triplicate. The graph was plotted between absorbance on x-axis and concentration on y-axis. Linear regression analysis was achieved by the least square method. The analysis of variance (ANOVA) was used to evaluate the linearity range.
Precision
The precision of the proposed analytical method was examined by inter-day, intra-day and inter-analyst variations. Intermediate precision was determined by analyzing three different levels of curcumin concentrations at 1, 4 and 8 µg mL-1. Solutions were prepared in triplicate at two different times during one day and analyzed for intra-day variations. To study inter-day and inter-analyst variations, same procedure was followed for two different days. The precision was measured using the percentage relative standard deviation (% RSD) of the expected concentrations. The mean absorbance of the samples was compared using a paired t-test with a 95% level of significance.
Accuracy
The accuracy of the proposed method was determined by knowing the % recovery of a known amount of drug added to nanogel formulation. Three different concentration levels of drug were used for accuracy measurement. The lower, intermediate and highest drug concentration for the experiment chosen was 1, 4 and 8 µg mL-1, respectively. Briefly, a known amount of stock solution was added into a 10 mL volumetric flask and diluted with methanol up to the mark of final volume. The samples were analyzed in triplicate. % RSD and % recovery were determined, and both has been employed to evaluate the accuracy of the method. The mean absorbance of the sample was compared using a paired t-test with a 95% level of significance.
Robustness
The robustness of the method was evaluated by changing the solvent procured from different suppliers and the temperature of drug samples. Briefly, the drug samples were prepared in a concentration of 4 µg mL-1. The samples were stored in refrigerator at 4°C, at different condition of temperature and relative humidity (25°C/60% RH and 40°C/65%RH) for 24 h. The content of the drug was determined under same condition in triplicate. % RSD was calculated.
Limits of detection (LOD and limit of quantification (LOQ
Limits of detection (k = 3.3) and limit of quantification (k = 10) were determined according to ICH guidelines. LOD and LOQ were calculated using standard deviation of the response and the slope of the corresponding curve. Following equations were used for calculation purpose;
LOD =3.3 X S/M, LOQ = 10 X S/M
where S, represents the standard deviation of the absorbance and M, slope of the calibrations curve.
Preparation of curcumin nanogel
The nanogel was prepared by dispersing solid lipid nanoparticles in a commonly used gelling agent carbopol. Briefly, 1% w/v of carbopol was soaked into double distilled water and left for 6 h for complete hydration and swelling. The pH was adjusted between the range of 6-6.5 using triethanolamine. The solid lipid nanoparticles were incorporated into the hydrated carbopol with mild stirring at 1000 rpm for 20 min to obtain curcumin nanogel. The final concentration of curcumin in nanogel was 1.8% w/w.
Drug content
5 g nanogel was dissolved in 50 mL of methanol and transferred into a 100 mL volumetric flask. The flask was sonicated for 30 min and diluted to 100 mL with methanol. The solution was filtered, suitably diluted with methanol, and absorbance was measured at 425 nm. The same procedure was followed for making the dilution of placebo nanogel and used as blank. The analysis was repeated three times. The possibility of interference was studied.
Hydrolytic degradation studies
Degradation kinetics of free curcumin and curcumin loaded nanogel was determined in different pH solutions according to method adopted in Indian Pharmacopoeia and Commission, 2014 (Indian Pharmacopoeia and Commission, 2014).17 Three pH solutions (PBS, pH 1.2, pH 6.8, and pH 7.4) were used for the study. A stock solution of free curcumin (10 mg of curcumin in 100 mL methanol = 100 µg mL-1) was prepared in methanol. 1 mL of stock solution was diluted to 10 mL of each buffer (10 µg mL-1). For nanogel formulation, 5 g nanogel was placed in a beaker and 100 mL methanol was added into it. The whole content was kept at room temperature for 1 h in order to remove the unentrapped drug. The drug content was determined and a stock solution was prepared in water followed by dilution with each buffer to give a concentration of 100 µg mL-1. The sample solutions were incubated at 37°C. At predetermined time point 0, 0.08, 0.25, 0.5, 1, 2, 3, 4, 5, 6, and 24 h, samples were taken and absorbance was recorded. The drug content remained was calculated with the help of calibration curve. The concentration vs. time, log concentration vs. time, and % drug remaining vs. time were plotted and degradation constant (k) was calculated.18, 2, 19
Results and Discussion
Method validation
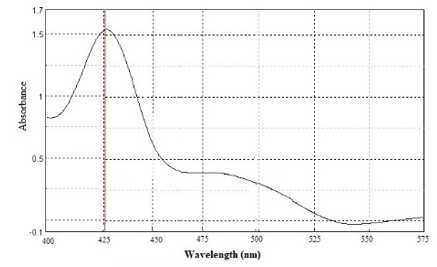
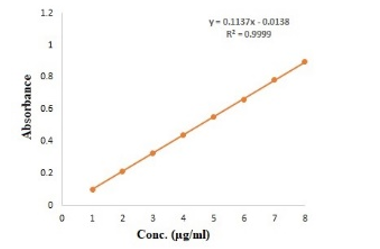
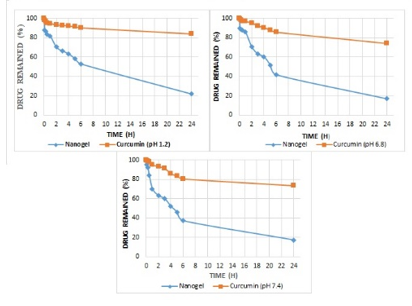
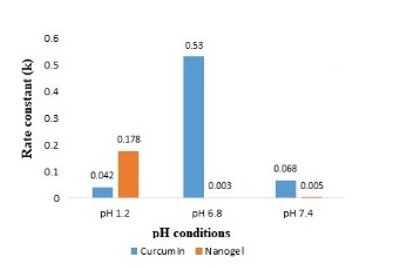
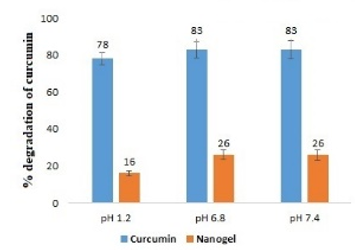
Different concentration of curcumin ranging from 1 to 8 μg mL-1 was scanned for absorption spectra. The absorption spectra showed maximum absorption peak (λmax) at 425 nm (Figure 1). There was no interference between solvent and curcumin as no extra peak observed at this wavelength. Hence, methanol was selected as suitable solvent system for method validation. There was no any change in absorption peak of curcumin at 425 nm in the presence of nanogel formulation components demonstrating the specificity of the method. Calibration curve was plotted between concentration of curcumin ranging from 1 to 8 μg mL-1 and respective absorbance (Figure 2). The value of absorbance with their respective concentration are given in Table 1. There was a linear relation between concentration and absorbance, obeys beer’s law over this range. The regression analysis data are summarized in Table 2. The % recovery ranged from 99.56 ± 0.59% to 100.52 ±1.27% (Table 3), mean value close to 100%, and low % RSD demonstrated the high accuracy of the analytical method. These results revealed that the small changes in the drug concentration in the solutions can be accurately measure by the proposed analytical method. Repeatability (% RSD) ranged from 0.28 to 0.87% for three levels of curcumin concentrations (Table 4). The method's repeatability (intra-day precision) results revealed precision under the same operating conditions over a short time period. Within-laboratory variances on different days by different analysts are expressed by inter-day precision. In the precision study, % RSD values were less than 2% in all cases and were within the acceptable range, indicating that the method has good repeatability and inter-day precision. The detection and quantitation limits were found to be 0.23 mg mL-1 and 0.75 mg mL-1, respectively. No statistically significant differences (Student´s t-test) were found when samples were subjected to temperature variations and diluted in solvents from different manufacturers (Table 5). Hence, the method was found to be robust in nature. The % remaining of free curcumin and nanogel formulation at different time points in various pH conditions are given in Table 6. The plot of time vs. % drug remained shows the kinetics of curcumin and nanogel formulation. The rate constant (k) for free curcumin at pH 1.2, 6.8 and 7.4 were 0.042 µg mL-1.h-1, 0.53 µg mL-1.h-1 and 0.068 µg mL-1.h-1, respectively. The rate constant for nanogel at pH 1.2, 6.8 and 7.4 were 0.178 h-1, 0.003 h-1 and 0.005 h-1, respectively. The results demonstrated zero order kinetics for free curcumin at all pH conditions, whereas the order of kinetics for nanogel formulation was first order (Figure 4). The zero-and first order rate constant (k) at different pH conditions are demonstrated in Figure 5. It was observed that curcumin undergoes 78 % degradation at acidic pH 1.2, and 83% at pH 6.8, and pH 7.4. Only 16% curcumin degradation was observed from nanogel formulation at acidic pH 1.2. On the other hand, only 26% curcumin degradation was recorded at pH 6.8 and 7.4 (Figure 6). The results indicate that nanogel formulation protect the drug from degradation at all pH condition.
Conclusion
The developed spectrophotometric method was found to be simple, robust, sensitive, accurate, precise, and reproducible. Developed method is cost effective as it doesn’t require mobile phase. The method can be used for analysis of curcumin in different formulations. The method was applied for degradation of free curcumin and curcumin loaded nanogel formulation in various physiological conditions. The degradation of curcumin from bulk drug and nanogel formulation showed zero order and first order kinetics, respectively. Furthermore, the method was without interference of excipients used in nanogel formulation.

