- Visibility 555 Views
- Downloads 43 Downloads
- Permissions
- DOI 10.18231/j.ijpca.2022.005
-
CrossMark

Quantitative estimation of sitagliptin and dapagliflozin propanediol monohydrate in synthetic mixture using 1 order derivative spectroscopy simultaneous spectrophotometric analysis
Abstract
Current research paper describes highly specific and reproducible 1st order derivative spectroscopic method for quantitative analysis of Sitagliptin which is a DPP4 inhibitors and Dapagliflozin which is SGLT2 inhibitors from its synthetic mixture. Both drugs are from Anti Diabetics class. Present analytical method was developed on Shimadzu double beam spectrophotometer equipped with UV probe 2.42 as software using methyl alcohol as solvent. Quantification of Sitagliptin was carried out at zero cross over point of Dapagliflozin that is 275 nm and for Dapagliflozin, it was achieved at 232 nm which is zero cross over point of Sitagliptin. Method shows linear response in the range of 25-125 µg/mL of Sitagliptin and 2.5-12.5 µg/mL of Dapagliflozin. Method was found to be accurate with recovery between 99.3 – 100.1 % for Sitagliptin and 98.2 – 100.7 % for Dapagliflozin. The developed method was validated as per ICH Q2 R1 guidelines and was successfully applied for quantitative analysis of synthetic mixture of Sitagliptin and Dapagliflozin.
Introduction
Sitagliptin (SITA) acting as Anti Diabetic agent (Dipeptidyl peptidase-4 inhibitor) which boosts post prandial insulin release, decrease Glucagon secretion and lower mean time as well as fasting blood glucose in type 2 diabetes.[1] This agent is used in combination with other oral hypoglycemic agents. Dapagliflozin (DAPA) acting as Sodium-Glucose cotransporter-2(SGLT2) inhibitors. This agent is used in combination with diet and exercise to improve glycemic control in adult with type -2 Diabetes. SGLT 2 is major transporter of glucose whose inhibition induces glucosuria and lower blood sugar in type 2 diabetes mellitus.[2] According to the clinical trial study of real-World Evidence with SGLT2i(DAPA) and DPP4i (SITA) in Type-2 Diabetes patients in Spain (NCT04149067)it shows beneficial positive effect on patient of Diabetes Mellitus (Type-2) at the close level of 5-10 mg of DAPA and 50-100 mg of SITA.[3] Best clinical effectiveness was observed at 100 mg dose of SITA and 10 mg of DAPA and hence for method development purpose dose was selected as a mixture comprising 10 mg of DAPA and 100 mg of SITA. Several analytical methods are available which can determine SITA and DAPA individually or in combination with another drug. From detailed review of literature, it was found that no analytical method is available for determination of DAPA and SITA from simulated mixture or formulation,[4], [5], [6], [7], [8], [9], [10], [11], [12], [13], [14], [15], [16], [17], [18], [19], [20], [21], [22], [23], [24] Furthermore UV spectrophotometric methods are more convenient with respect to operation in comparison with chromatographic methods of analysis. In addition, derivative spectroscopy aids virtue of specificity to the analytical method due to estimation at Zero Cross Over point (ZCP). So for the same reason derivative spectroscopy was selected as method of choice from all other multi component UV spectrometric methods.
|
preparation of solutions for Accuracy studies |
|||
|
Unspiked |
50% |
100% |
150% |
|
Placebo |
Placebo |
Placebo |
Placebo |
|
|
Weigh accurately 2.5 mg of DAPA and 25 mg of SITA in 10 ml calibrated volumetric flask |
Weigh accurately 5 mg of DAPA and 50 mg of SITA in 10 ml calibrated volumetric flask |
Weigh accurately 7.5 mg of DAPA and 75 mg of SITA in 10 ml calibrated volumetric flask |
|
Contents diluted up to 10 ml calibrated volumetric flask with Methyl Alcohol and filter the solution (A) |
|||
|
Take 1 ml of this filtrate and dilute up to 10 ml with Methyl alcohol (B) |
|||
|
|
To achieve final concentration, 1 ml of solution B diluted up to 10 ml with Methyl Alcohol (2.5+25 µg/ml) |
To achieve final concentration, 1 ml of solution B diluted up to 10 ml with Methyl Alcohol (5+50 µg/ml) |
To achieve final concentration, 1 ml of solution B diluted up to 10 ml with Methyl Alcohol (7.5+75 µg/ml) |
|
Sr. No. |
Concentration (µg/mL) |
Mean (D 1 abs.) + S.D. |
R.S.D. (%) |
|
1. |
25 |
-0.0062 ± 0.00007 |
1.2031 |
|
2. |
50 |
-0.0131 ± 0.00012 |
0.9118 |
|
3. |
75 |
-0.0208 ± 0.00012 |
0.6081 |
|
4 |
100 |
-0.0284 ± 0.00014 |
0.5160 |
|
5. |
125 |
-0.0367 ± 0.00008 |
0.2177 |
|
Sr. No. |
Concentration (µg/mL) |
Mean (D1 abs.) + S.D. |
R.S.D. (%) |
|
1. |
2.5 |
-0.0057 ± 0.00004 |
0.8534 |
|
2. |
5.0 |
-0.0128 ± 0.00011 |
0.8879 |
|
3. |
7.5 |
-0.0192 ± 0.00012 |
0.6378 |
|
4 |
10 |
-0.0268 ± 0.00016 |
0.618 |
|
5. |
12.5 |
-0.0326 ± 0.00011 |
0.3568 |
|
|
concentration (µg/mL) |
||||
|
Sr. no. |
25 |
50 |
75 |
100 |
125 |
|
1 |
-0.0063 |
-0.0133 |
-0.0208 |
-0.0285 |
-0.0368 |
|
2 |
-0.0062 |
-0.0133 |
-0.021 |
-0.0286 |
-0.0367 |
|
3 |
-0.0063 |
-0.013 |
-0.0206 |
-0.0285 |
-0.0368 |
|
4 |
-0.0062 |
-0.0131 |
-0.0208 |
-0.0282 |
-0.0366 |
|
5 |
-0.0061 |
-0.0131 |
-0.0208 |
-0.0286 |
-0.0368 |
|
Mean |
-0.0062 |
-0.0131 |
-0.0208 |
-0.0284 |
-0.0367 |
|
S.D. |
0.00007 |
0.00012 |
0.00012 |
0.00014 |
0.00008 |
|
R.S.D. (%) |
1.2031 |
0.9118 |
0.6081 |
0.5160 |
0.2177 |
|
|
concentration (µg/mL) |
||||
|
Sr. no. |
2.5 |
5 |
7.5 |
10 |
12.5 |
|
1 |
-0.0057 |
-0.0130 |
-0.0193 |
-0.0265 |
-0.0328 |
|
2 |
-0.0058 |
-0.0129 |
-0.0192 |
-0.0266 |
-0.0327 |
|
3 |
-0.0057 |
-0.0128 |
-0.019 |
-0.0268 |
-0.0326 |
|
4 |
-0.0058 |
-0.0128 |
-0.0193 |
-0.0269 |
-0.0328 |
|
5 |
-0.0057 |
-0.0127 |
-0.0192 |
-0.0266 |
-0.0325 |
|
Mean |
-0.0057 |
-0.0128 |
-0.0192 |
-0.0266 |
-0.0326 |
|
S.D. |
0.00004 |
0.00011 |
0.00012 |
0.00016 |
0.00011 |
|
R.S.D. (%) |
0.8534 |
0.8879 |
0.6378 |
0.6158 |
0.3568 |
|
Concentration (µg/ml) |
Intraday Mean + SD |
%RSD |
Inter-Day Mean + SD |
%RSD |
|
25 |
-0.0062 ± 0.00007 |
1.2031 |
-0.0062 ± 0.00006 |
1.0200 |
|
75 |
-0.0208 ± 0.00012 |
0.6081 |
-0.0208 ± 0.00013 |
0.6509 |
|
125 |
-0.0367 ± 0.00008 |
0.2177 |
-0.0367 ± 0.00008 |
0.2437 |
|
Concentration (µg/ml) |
Intraday Mean + SD |
%RSD |
Inter-Day Mean + SD |
%RSD |
|
2.5 |
-0.0057 ± 0.00004 |
0.8534 |
-0.0055 ± 0.00004 |
0.8842 |
|
7.5 |
-0.0192 ± 0.00012 |
0.6378 |
-0.0192 ± 0.00010 |
0.5300 |
|
12.5 |
-0.0326 ± 0.00011 |
0.3568 |
-0.0327 ± 0.00010 |
0.3349 |
|
Level of spiking |
Total placebo (mg) |
Amount of std. drug added (µg/ml) |
Amount of drug recovered (µg/ml) |
% Rsecovery |
|||
|
SITA |
DAPA |
SITA |
DAPA |
SITA |
DAPA |
||
|
Unspiked |
|
- |
- |
- |
- |
- |
- |
|
50 % |
|
25 |
2.5 |
24.88 ± 0.111 |
2.48 ± 0.004 |
100.1 ± 0.47 |
99.0 ± 0.18 |
|
100 % |
|
50 |
5 |
49.67 ± 0.008 |
5.03 ± 0.212 |
99.3 ± 0.06 |
100.7 ± 0.42 |
|
150 % |
|
75 |
7.5 |
75.66 ± 0.607 |
7.36 ± 0.004 |
100.1 ± 0.60 |
98.2 ± 0.78 |
|
Drug |
Amount taken (µg/mL) |
Amount recovered (µg/mL) |
% Assay |
|
SITA |
125 |
124.99 ± 0.6 |
100.0 ± 0.6 |
|
DAPA |
12.5 |
12.6 ± 0.7 |
100.6 ± 0.7 |
Materials and Methods
Materials
DAPA (99.98% pure) and SITA (99.96% pure) were obtained as gift sample for research purpose from, Cadila Healthcare Ltd., Sanand. Methyl alcohol (LR grade) was purchase from S.D. fines.
Instrument and experimental conditions
Spectrophotometric analysis was performed on shimadzu UV-1800 double beam spectrophoto-meter having path length of 1 cm matched pair of quartz cells. Obtained spectra of SITA and DAPA were derivatized 1st order using UV probe 2.42 as software at delta ʎ of 10 nm
Preparation of master stock solution
For the method development purpose, 10 mg of SITA was weighed and diluted to 10 mL (1000 µg/mL) and was further diluted to give final concentration of 250 µg/mL. In similar way 50 mg of DAPA was weighed and diluted to 100 ml (500 µg/mL) and was further diluted to give final concentration of 25 µg/mL.
Selection of analytical wavelength
The working standards of SITA (25-125 μg/ml) and DAPA (2.5-12.5 μg/ml) were prepared in 10 ml volumetric flask using methyl alcohol as a solvent. They were scanned in the UV range of 200 – 400 nm and D0 spectra is recorded by UV spectrophotometer. All the D0 spectra of SITA and DAPA were transformed into D1 spectra with the help of UV probe 2.42 software. For confirmation of D1 spectra of SITA and DAPA, D0 and D1 spectra of the same were overlapped.
Preparation of solutions for analytical method validation
Preparation of solution for linearity and range
To check linearity of method, SITA was prepared in the concentration range of 25-125 µg/ml and DAPA was prepared in the range of 2.5-12.5 µg/ml from master stock solution in 10 ml volumetric flask. When D1 Absorbance was plotted against concentration, non-linearity was observed above 150 µg/ml for SITA and above 20 µg/ml for DAPA so final range for validation was selected at mixture containing 25-125 µg/ml for SITA and 2.5-12.5 µg/ml for DAPA. All prepared solutions were scanned between 200-400 nm and all spectra were derivatized to 1st order. D1 absorbance were obtained at selected wavelength and mean D1 absorbance was plotted against concentration (To get mean D1 absorbance, procedure was repeated for five times)
Intermediate precision (Repeatability)
To adjudge the repeatability of analytical method, solution of linearity studies were analyzed for five time with same conditions. Mean D1 absorbance was recorded at all concentration for SITA and DAPA and were observed for relative standard deviation.
Method precision
Method precision was determined by performing intraday and interday precision. Mixture that represents overall range (2.5+25, 7.5+75 and 12.5+125 µg/mL) were analyzed on same day at different time interval for intraday precision. Mixture that represents overall range (2.5+25, 7.5+75 and 12.5+125 µg/mL) were analyzed on different days for interday precision.
Accuracy study
Accuracy of analytical method was adjudged by spiking of placebo with standard solution. Mixture containing 100 mg of directly compressible lactose, 2mg of talc and 2 mg of magnesium stearate was selected as placebo and was spiked at 50, 100 and 150% of target concentration (5+50 µg/mL) ([Table 1]). Placebo (un spiked) was analyzed at given wavelengths for any possible interference. Each spiked concentration was analyzed for three times and mean % recovery was observed at each spiked level.
Solvent stability
Solvent stability was determined by scanning the same solution prepared in selected solvent (methyl alcohol) at 3 different time interval that is at 0 hour, 6 hours and 24 hours. Mixture of 12.5+125 µg/ml solution of SITA and DAPA in methyl alcohol were scanned at selected time interval and characteristics of spectra were compared (λmax).
Assay
As the proposed synthetic mixture is having dose of 10 mg of DAPA and 100 mg of SITA, was mixed with selected placebo, and diluted appropriately to give mixture containing 125 µg/ml of SITA and 12.5 µg/ml of DAPA. This mixture was scanned between 200-400 nm and was derivatized to 1st order. D1 absorbance was measured at selected wavelengths and were transformed to concentration with help of linear regression equation. This mixture was analyzed for three times and mean % assay was drawn.
Result and Discussion
Selection of analytical wavelength
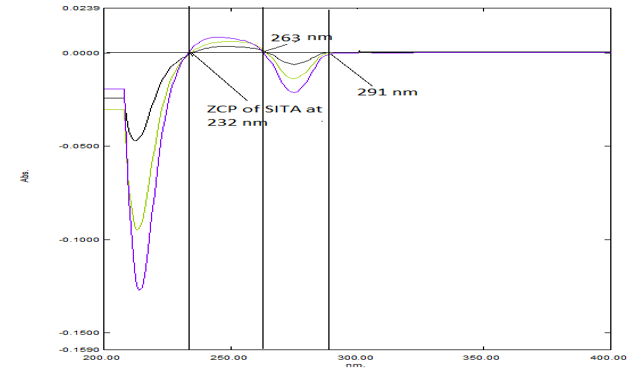
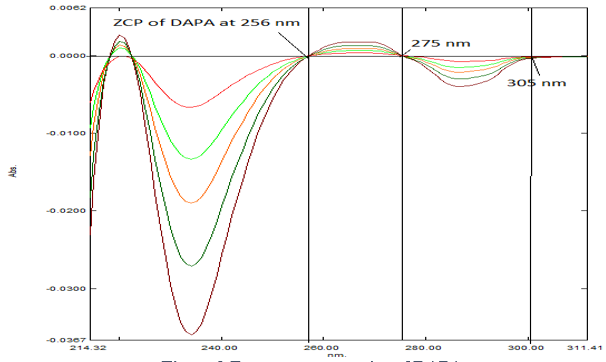
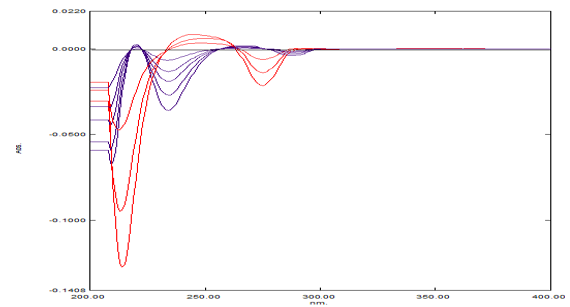
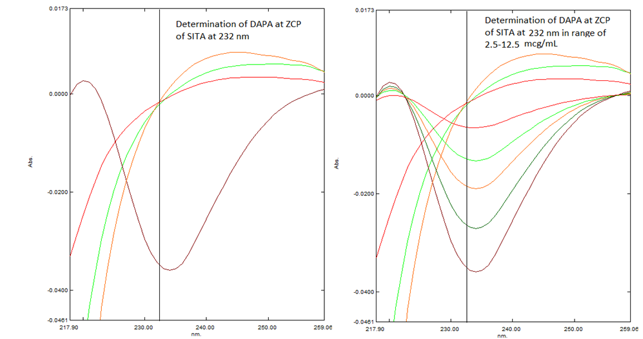
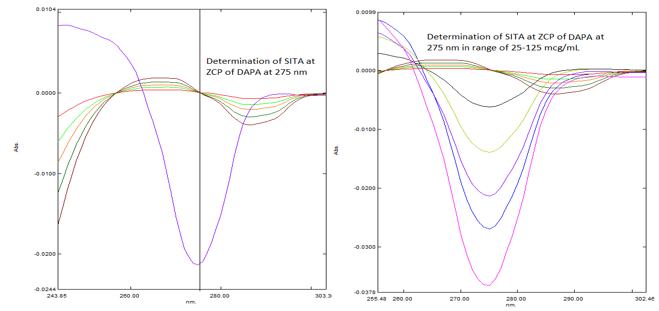
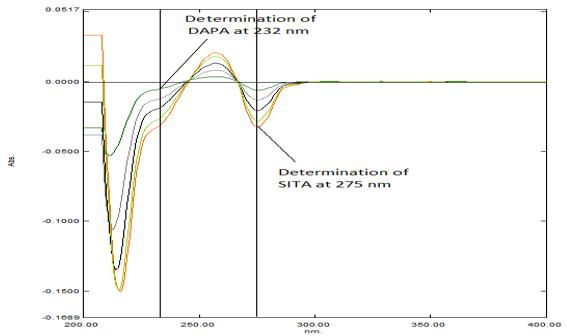
Three different ZCP at 232 nm, 263 nm and 291 nm were observed in overlain D1 spectra of SITA ([Figure 1]). Three different ZCP at 256 nm, 275 nm and 305 nm were observed in overlain D1 spectra of DAPA ([Figure 2]). For determination of analytical wavelength D1 spectra of SITA and DAPA were overlapped ([Figure 3]). But there is very less difference between absorbance values of DAPA at 291 nm and hence difficulty in quantifying the same. Discussed problem can be eliminated at 232 nm, where the D1 absorbance values of DAPA are linear with significant difference ([Figure 4]). In similar way at ZCP of DAPA, linearity was observed only at 275 nm for SITA ([Figure 5]). So 232 nm and 275 nm were selected as analytical wavelength for quantitative determination of DAPA and SITA respectively.
Analytical method validation
All validation parameters were studied as per ICH guidelines.[25], [26]
Linearity and range
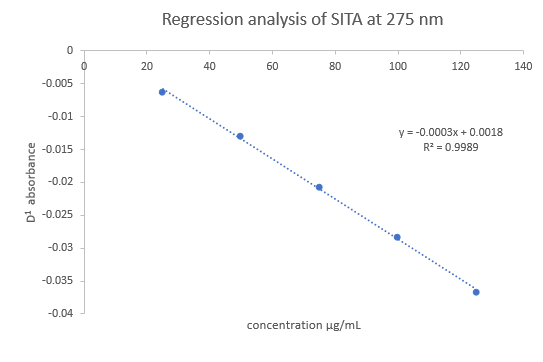
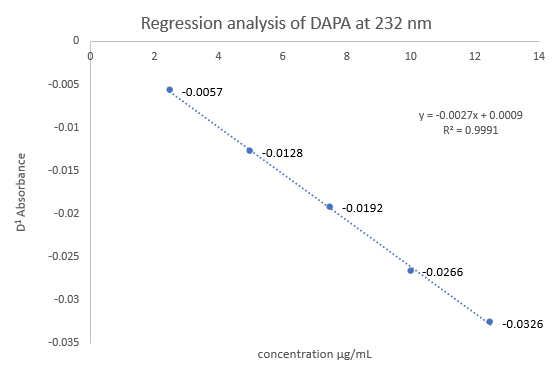
When D0 spectra of SITA was taken between 25 - 150 µg/mL, non-linearity was observed over 150 µg/mL. So, linearity for SITA was observed between 25 - 150 µg/mL. for method development purpose range was selected between 25 - 125 µg/mL (based on beer — lambert’s law). In similar way D0 spectra of DAPA was taken between 2.5 - 20 µg/mL, but non-linearity was observed over 20 µg/mL. So, linearity for DAPA was observed between 2.5 - 20 µg/mL. and for method development purpose range was selected between 2.5 - 12.5 µg/mL (based on beer — lambert’s law). So final range for validation was selected at mixture containing 25 - 125 µg/ml for SITA and 2.5-12.5 µg/ml for DAPA ([Figure 6]). When calibration curve was plotted for given concentration range ([Figure 7], [Figure 8]), value of linear regression coefficient was found to be 0.9989 for SITA and 0.9991 for DAPA. Regression equation was found to be y = 0.0003 X + 0.0018 for SITA and y = 0.0027 X + 0.0009 for DAPA. Linearity data for both drugs is shown in [Table 2], [Table 3]
Repeatability
When all mixtures were analyzed at all concentration, calculated relative standard deviation at each level was found to be less than 2 so that method was found to be repeatable over the range of 25 - 125 µg/ml for SITA and 2.5 - 12.5 µg/ml for DAPA. Repeatability data are shown in table 4 and 5 for SITA and DAPA respectively.
Method precision
For determining inter day and intraday precision, % RSD was monitored at selected concentration level which was found to be less than 2 so method was found to be precise for estimation of SITA and DAPA. Data for intermediate precision are given in [Table 6], [Table 7] for SITA and DAPA respectively.
Accuracy study
Spiked placebo with standard solution at 50, 100 and 150% level was analyzed for % recovery which was found within 98 to 102, so method was found to be accurate ([Table 8]).
Solvent stability
As the λmax was stable over period of 24 hrs, the solvent was found to be suitable and drug was found to be stable.
Assay
When prepared synthetic mixture was analyzed by developed and validated method, % assay was found to be 100.0 ± 0.6 for SITA and for 100.1 ± 0.7 DAPA ([Table 9])
Summary and Conclusion
The 1st order derivative spectroscopic method was developed and validated as per ICH Q2 R1 guidelines and was successfully applied for determination of SITA and DAPA from its synthetic mixture. Present method was found to be economical in terms of cost and time. Commonly used excipient didn’t interfere in estimation of SITA and DAPA so method was found to be specific. Method was also found to be repeatable and precise.
Acknowledgment
Authors are extremely grateful to Cadila Healthcare Ltd. for providing gift sample of DAPA and SITA without them this work would not have taken place. We are also thankful to overall research team who have contributed in either of the way. The authors are also grateful to Smt. S.M. Shah Pharmacy College for providing excellent research facilities and promoting research activities.
Author contributions
Shivani Jani- Collection of all the data after the completion of the research work and the preparation of manuscript was done by Shivani Jani.
Rashmi Shukla- After designing the project, execution of project was carried out by Rashmi Shukla.
Pinak Patel- The design of the study from choosing the drug to choosing the method was done by Pinak Patel.
Binny Mehta- After completion of the study, analysis of the data obtained from UV was done by Binny Mehta.
Krunal Detholia- During the study, synthetic mixture preparation according to the dose of the drugs was done by Krunal Detholia.
Source of Funding
None.
Conflict of Interest
None.
References
- Ravinandan AP, Basavanagowda GM, Jimmy OD. Review on Sitagliptin. Int J Pharm Res Scholars. 2014;3(2):577-81. [Google Scholar]
- Theodosios D, Filippatos EN, Liberopoulos MSE. Dapagliflozin in patients with type 2 diabetes mellitus. Ther Adv Endocrinol Metab. 2015;6(1):29-41. [Google Scholar] [Crossref]
- Serge A, Jennfer EH, Parikh S. Dapagliflozin is effective as add on therapy to Sitagliptin with Metformin: A 24-week, Multicenter, Randomized, Double -blind, Placebo controlled study. Diab Care. 2014;37:740-50. [Google Scholar]
- Jani BR, Shah KV, Kapupara PP. Development and validation of UV spectroscopic first derivative method for simultaneous estimation of Dapagliflozin and Metformin hydrochloride in synthetic mixture. J Bio equiv. 2015;4(3):1569-76. [Google Scholar]
- Bodade BJ, Da K, Chaudhari SS. Quantitative Estimation of Dapagliflozin in blood plasma by using UV Spectroscopy. Pharma Analytica Acta. 2019;10(2):2153-2435. [Google Scholar]
- Sanagapati M, Dhanlakshmi K, Kavitha B. Method Development and validation of Dapagliflozin API by UV spectroscopy. Int J Pharm Sci Drug Res. 2014;6(3):250-2. [Google Scholar]
- Mante GV, Gupta RK, Hemke AT. Estimation of Dapagliflozin from its Tablet Formulation by UV spectroscopy. Pharm Methods. 2017;8(2):102-7. [Google Scholar]
- Sundar S, Vasanthi P, Algar R, Rao K, Dutt R. Development and validation of RP-HPLC method for simultaneous estimation of Dapagliflozin and Metformin in bulk and in synthetic mixture. World J Pharm Pharm Sci. 2017;6(7):2139-50. [Google Scholar]
- Suma BV, Deveswar R, Shenoy A. A new High Performance Thin Layer Chromatographic Method Development and Validation of Dapagliflozin in bulk and tablet dosage from. Int J Pharm Pharm Sci. 2019;11(8):58-63. [Google Scholar]
- Mante GV, Hemke AT, Umekar MJ. RP-HPLC Method for Estimation of Dapagliflozin from its Tablet. Int J ChemTech Res. 2018;11(01):242-8. [Google Scholar]
- Nalla S. A Stability Indicating Rp-hplc Method For Simultaneous Estimation Of Velpatasvir And Sofosbuvir In Combined Tablet Dosage Forms.. World J Pharm Pharm Sci. 2017;4:1596-1611. [Google Scholar]
- Parmar SH, Luhar D. Dr Narkheda SB. Developmetnt and Validation of UV-spectroscopy first derivative and High Performance Thin Layer Chromatography analytical method for simultaneous estimation of Dapagliflozin propanediol monohydrate and Saxagliptin hydrochloride in synthetic mixture. Eur J Biomed Pharm Sci. 2018;5(5):668-81. [Google Scholar]
- Zameeruddin M, Sandhya S, BV, NH, Sandip T. Development and validation of UV spectroscopic method for simultaneous estimation of Dapagliflozin and Saxagliptin in synthetic mixture. Int J Chem Pharm Anal. 2019;8(1):59-66. [Google Scholar]
- Rathor S, Patil P, Chapada V. Development and Validation of HPTLC method for the estimation of Sitagliptin Phosphate and Simvastatin in bulk and marketed formulation. Int J Drug Dev and Res. 2012;4(3):292-7. [Google Scholar]
- Tarkase KN, Saroda MB, Sa G, Gawade A. Development and Validation of UV spectrophotometric method for estimation of Sitagliptin Phosphate. Der Pharmacia Lettre. 2010;3(3):315-8. [Google Scholar]
- Arul CG, Thangavel P, Murugesan J, Srinivasan K, Thangavel S. Analytical method for determination of Sitagliptin An Updated Review. Int J Pharm Sci Rev Res. 2017;43(1):217-25. [Google Scholar]
- Reichal RC, Rao GM. Development and Validation of spectroscopic method for simultaneous estimation of Gliclazide and Sitagliptin Phosphate monohydrate in bulk and pharmaceutical dosage form. Int J Pharm Pharm Sci. 2015;7(6):372-6. [Google Scholar]
- Reddy B, Raman N, Kumar BS, Chintal R. Chiral separation of Sitagliptin phosphate enantiomer by HPLC using amylose based chiral stationary phase. J Pharm Res. 2013;7(6):546-50. [Google Scholar] [Crossref]
- Srisiha RG, Vasanth PM, Ramesh T, Malothu R. RP-HPLC method development and validation for simultaneous estimation of Metformin and Sitagliptin in tablet dosage forms. Int J Pharm Res Anal. 2013;3(3):8-12. [Google Scholar]
- Jalkote RN, Kalshetti D. UV Spectrophotometric method development and validation for determination of Sitagliptin in API and in pharmaceutical dosage form. World J Pharm Pharma Sci. 2019;8(5):916-25. [Google Scholar]
- Raja T, Rao L. Validation HPTLC method for simultaneous estimation of Metformin hydrochloride and Sitagliptin phosphate in bulk drug and formulation. Rasayan J Chem. 2012;5(3):407-13. [Google Scholar]
- Karimulla SK, Vasanth PM, Ramesh M. Method development and validation of Sitagliptin and Metformin using reverse phase HPLC method in bulk and tablet dosage form. Scholar Research Library. Der Pharmacia Lettre. 2013;5(5):168-74. [Google Scholar]
- Abirami G, Vetrichelvan T. Validated HPTLC method for simultaneous estimation of Sitagliptin phosphate and Simuvastin in tablet dosage form. Scholar Res Libr Der Pharm Lettre. 2016;8(4):6-12. [Google Scholar]
- . GUIDELINE: validation of analytical procedure: Text and Methodology Q2(R2). . 2005. [Google Scholar]
- . . Analytical Procedures and methods Validation for Drugs and Biologics: U.S. Department of Health and Human services. 2015. [Google Scholar]
- Sowjanya G, Ganapaty S, Almas S. Derivative UV Spectroscopic approaches in multicomponenet analysis -A review. Int J Pharm Pharm Sci. 2019;11(2):1-11. [Google Scholar]
- Abstract
- Introduction
- Materials and Methods
- Materials
- Instrument and experimental conditions
- Preparation of master stock solution
- Selection of analytical wavelength
- Preparation of solutions for analytical method validation
- Method precision
- Accuracy study
- Solvent stability
- Assay
- Result and Discussion
- Selection of analytical wavelength
- Analytical method validation
- Linearity and range
- Repeatability
- Method precision
- Summary and Conclusion
- Acknowledgment
- Author contributions
- Source of Funding
- Conflict of Interest
- References