- Visibility 621 Views
- Downloads 133 Downloads
- Permissions
- DOI 10.18231/j.ijpca.2021.019
-
CrossMark

Simultaneous estimation of pioglitazone, glimepiride & metformin hydrochloride in bulk & tablet dosage form by UV, RP-HPLC method
Abstract
A stability-indicating UV spectroscopic and high-performance liquid chromatography (RP-HPLC) method is developed for the quantification of Pioglitazone, Glimepiride & Metformin Hydrochloride drug substances. UV spectroscopic method was developed and validated, the wavelength selected for simultaneous estimation were 226nm for pioglitazone, 229nm for glimepiride and 232nm for metformin hydrochloride. The isosbestic point found for the analysis was 229nm. Selected mobile phase was a combination of methanol and water with a ratio of 70% Methanol and 30 % HPLC water with the flow rate of 0.85ml/min. The analyte was analysed on the C18 HPLC column having the pore size of 5 microns at room temperature. The method is validated according to ICH guidelines, the retention time of about 4.0min for metformin, 5.5min for Pioglitazone and 6.8min for Glimepiride was observed. The linearity range with regression co-efficient for Pioglitazone, Glimepiride & Metformin Hydrochloride is 3-15 μg/mL,0.4-1.2 μg/mL and 100-500 μg/mL and 0.9998, 0.9991, 0.9991 respectively.
Introduction
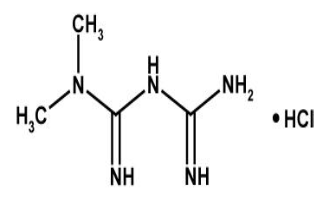
Metformin Hydrochloride is a anti-diabetic drug which belongs to Biguanides drug class. The chemical formula for Metformin hydrochloride is C4H12ClN5. Metformin is prescribed with other medication to control high blood sugar with instruction to follow proper diet and exercise program. It is used to treat patients with type 2 diabetes. Metformin exerts its anti-diabetic action through suppression of generation of glucose in the liver.[1], [2], [3] Till date, two important molecular targets of metformin have been identified, both of which are present in mitochondria.[2], [3], [4] Metformin acts on mitochondrial respiratory complex I by inhibiting its function, which results in increasing in the cellular ratio of adenosine monophosphate (AMP) to adenosine triphosphate (ATP) as a result of a reduction in the efficiency of ATP production. This increase in the ratio of AMP: ATP triggers the activation of AMP‐activated protein kinase (AMPK), which has alot of effects on energy metabolism, also down regulation of the expression of gluconeogenic genes is controlled by it.[2] The activity of adenylate cyclase is also thought to be inhibited by increase in AMP concentration[5], it is an important mediator of glucagon action, therefore results in the inhibition of gluconeogenesis. The second target of metformin in mitochondria is mitochondrial glycerol‐3‐phosphate dehydrogenase, [4] which plays a key role in the glycerophosphate shuttle. This oxidoreduction shuttle between the cytosol and mitochondria is necessary for production of the oxidized form of coenzymes required for biochemical reactions, such as nicotinamide adenine dinucleotide in gluconeogenic reactions. The activity of mitochondrial glycerol‐3‐phosphate dehydrogenase is also inhibited by metformin, which suppresses gluconeogenic reactions including the conversion of lactate to pyruvate.[4]
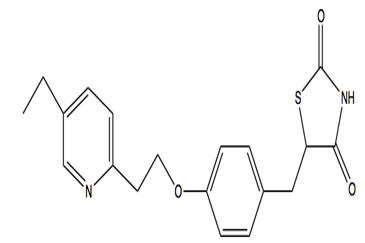
Pioglitazone hydrochloride is another anti-diabetic drug with chemical formula CHNOS. Pioglitazone hydrochloride belongs to drug class thiazolidinedione that depends on the presence of insulin for its mechanism of action. Pioglitazone hydrochloride decreases insulin resistance in the periphery and in the liver which results in increasing the insulin-dependent glucose disposal and decreasing hepatic glucose output. Pioglitazone isecretagogue. [6]Pioglitazone has agonist action for peroxisome proliferator-activated receptor-gamma (PPARgamma). PPAR receptors are found in tissues such as adipose tissue, skeletal muscle, and liver which are important for insulin action.[7], [8], [9], [10], [11], [12], [13], [14], [15], [16]PPARgammametabolism.
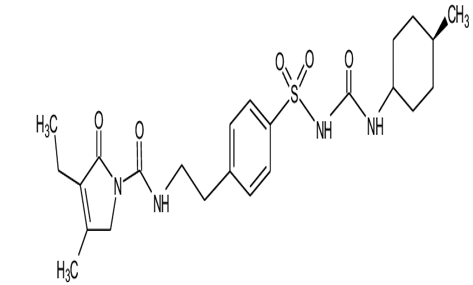
Glimepiride is a potent anti-diabetic drug which belongs to Sulfonylurea drug class. Its chemical formula is C24H34N4O5S.It is used to treat patients with type 2 diabetes. It is prescribed with other medication with proper diet and regular exercise routine. Route of administration is oral it is available in tablet form and the elimination half life of glimepiride is 5-8 hours. Glimepiride exerts its action by increasing insulin release from the pancreas and by improving glucose tolerance. It acts on the "sulfonylurea receptors" on pancreatic β-cell membrane and reduces conductance of ATP sensitive K+ channels and thus causes depolarization. Due to this the Ca2+ influx and degranulation is enhance which in turn increases insulin secretion rate at any glucose concentration.[17] It primarily increases 2nd phase insulin secretion and has little effect on 1st phase. The hepatic degradation of insulin and minor action of reducing glucagon release and increasing somatostatin release is also slowed down. It sensitizes the target tissues such as liver to insulin action and exerts strong extrapancreatic action. Number of insulin receptors are increased and by a post receptor action translation of receptor activation is enchanced.
Materials and Methods
All the three drugs i.e Pioglitazone, Glimepiride & Metformin Hydrochloride were obtained from RAP Analytical research and training centre and all the chemicals used were of HPLC grade were purchased from Thermofisher pvt ltd. The balance used for weighing is a high precision balance from Wensar with model no. PGB 100. The mobile phase was degassed using Wensar Ultra sonicater and was filtered using Ultra filtration with a membrane filter size of 0.45 microns. For UV spectroscopy, double beam instrument maufactured by Analytical Technologies Ltd. with Model no- UV-2012 was used. The software used for analysis was UV-VIS Analyst.[18], [19], [20], [21], [22], [23], [24], [25] The instrument used for the High Performance Liquid Chromatography consisted of binary gradient system. The software used of the HPLC instruments for the method development and the validation purpose was HPLC workstation. The maker of the HPLC system is analytical technologies Pvt. Ltd. with model number HPLC 3000 series. Reciprocating type of pump was used for the analysis of model no.P-3000M. The detector used was UV-VIS detector of single wavelength with the model no. of UV3000M. The C18 type of column was used for the separation which was form cosmosil make having the dimension of 250mm X 4.6mm (ID), particle size of 5micron.
Sample preparation
Accurately 10mg of Pioglitazone, glimepride, metformin hydrochloride drug sample was weighed and transferred to 10ml volumetric flask individually, then it was dissolved using 5ml solvent(mobile phase) and then it was diluted up to the mark which makes stock solution of 1000 μg/ml. Working solution was made as per the requirement.
Method development
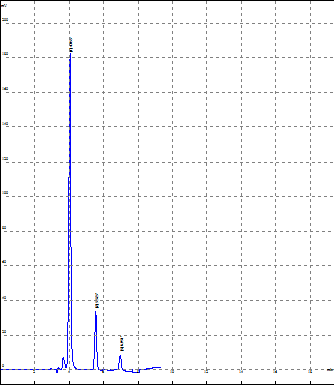
In order to obtain resolution of the three drugs that is to develop sharp and well resolved peaks various trials were carried out. By changing the ratio of mobile phase methanol and water various trial were taken and it was observed that all the three drugs were well resolved at the 70% methanol and 30% water at 229 nm. The flow rate of the mobile phase was taken at 0.8 ml/min. Optimised results was shown below of all three drugs
|
Rank |
Time |
Area |
Resolut. |
T.Plate |
Num asymmetry |
|
1 |
4.033 |
1618046 |
6.25 |
6955 |
1.03 |
|
2 |
5.523 |
327268 |
4.64 |
7446 |
1.00 |
|
3 |
6.951 |
148683 |
0.00 |
7768 |
1.16 |
Result
All the System Suitability parameters i.e resolution, number of theoretical plates, asymmetry of peaks were found to be within the range which is indicating the performance of the system.
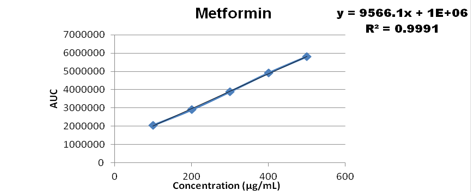
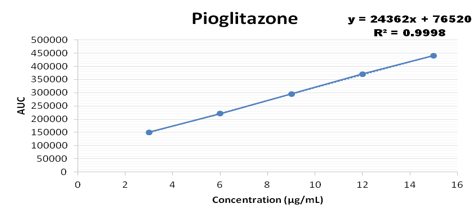
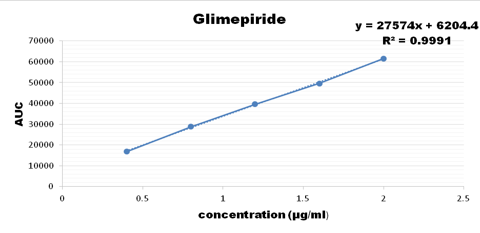
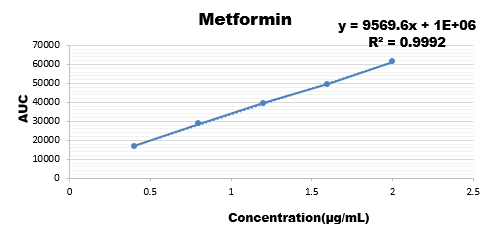
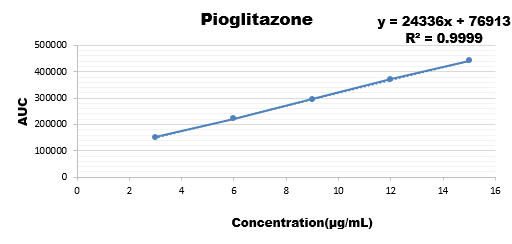
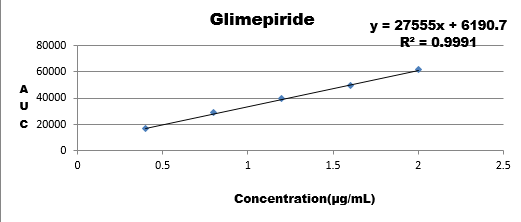
Linearity
Statistically the response of the analyte and the concentration were calculated in order to check the linearity of all the three drugs.
Concentration range from 100-500 ug/ml were taken for metformin, 3-15 ug/ml for pioglitazone, 0.4-1.2 ug/ml for glimepiride and the calibration curve was plotted as shown below
Accuracy
Triplicates of all the three drugs were taken for the recording the data of accuracy and the %RSD for all the drugs were calculated whose data is as follows
|
|
|
|
Standard Deviation |
Accuracy |
Precision |
|
|
Conc. |
Conc. (µg/ml) |
Area |
Mean |
SD |
%SD |
%RSD |
|
1 |
100 |
2046657 |
2050075.667 |
5334.913807 |
0.2602301 |
0.113609507 |
|
|
|
2056223 |
|
|
|
|
|
|
|
2047347 |
|
|
|
|
|
3 |
300 |
3890897 |
3889568.333 |
4343.197017 |
0.1116627 |
|
|
|
|
3884716 |
|
|
|
|
|
|
|
3893092 |
|
|
|
|
|
5 |
500 |
5822073 |
5819824 |
2156.827068 |
0.03706 |
|
|
|
|
5819626 |
|
|
|
|
|
|
|
5817773 |
|
|
|
|
|
|
|
Standard Deviation |
Accuracy |
Precision |
|
|
Comp. |
Conc.( µg/ml) |
Area |
Mean |
SD |
%SD |
%RSD |
|
1 |
3 |
150344 |
149863 |
443.2527496 |
0.295772 |
0.133370602 |
|
|
|
149471 |
|
|
|
|
|
|
|
149774 |
|
|
|
|
|
3 |
9 |
295283 |
295235.6667 |
108.0755908 |
0.0366065 |
|
|
|
|
295312 |
|
|
|
|
|
|
|
295112 |
|
|
|
|
|
5 |
15 |
440904 |
441075.3333 |
491.9119162 |
0.1115256 |
|
|
|
|
440692 |
|
|
|
|
|
|
|
441630 |
|
|
|
|
|
|
|
Standard Deviation |
Accuracy |
Precision |
|
|
Comp |
Conc.( µg/ml) |
Area |
Mean |
SD |
%SD |
%RSD |
|
1 |
0.4 |
16831 |
16780 |
50.02999101 |
0.2981525 |
0.135143733 |
|
|
|
16731 |
|
|
|
|
|
|
|
16778 |
|
|
|
|
|
3 |
1.2 |
39633 |
39582.66667 |
46.97162264 |
0.1186672 |
|
|
|
|
39540 |
|
|
|
|
|
|
|
39575 |
|
|
|
|
|
5 |
2 |
61560 |
61538.66667 |
20.55075018 |
0.0333949 |
|
|
|
|
61519 |
|
|
|
|
|
|
|
61537 |
|
|
|
From the above results it is observed that for all the three drugs the % RSD is less than 2% which is within the acceptance limit.
% Recovery
Three concentration range of percentages were injected in order to analyse the recovery of the analyte in the formulation. Following are the results for the same.
|
Sr.no. |
% Composition |
Area of Standard |
Area of Sample |
% Recovery |
|
1 |
50% Recovery |
3890897 |
3881879 |
99.76822825 |
|
2 |
100% Recovery |
4914355 |
4917149 |
100.0568538 |
|
3 |
150% Recovery |
5822073 |
5816256 |
99.90008713 |
|
Sr.no. |
% Composition |
Area of Standard |
Area of Sample |
% Recovery |
|
1 |
50% Recovery |
295283 |
295340 |
100.0193035 |
|
2 |
100% Recovery |
371066 |
371107 |
100.0110492 |
|
3 |
150% Recovery |
440904 |
440600 |
99.93105075 |
|
Sr.no. |
% Composition |
Area of Standard |
Area of Sample |
% Recovery |
|
1 |
50% Recovery |
39633 |
39530 |
99.74011556 |
|
2 |
100% Recovery |
49640 |
49603 |
99.92546334 |
|
3 |
150% Recovery |
61560 |
61593 |
100.0536062 |
Assay
Assay is the analysis of the marketed formulation which is checked against the standard solution. The results obtained for three drugs are:
|
Sr. NO. |
% Composition |
Area of Standard |
Area of Sample |
% Assay |
|
1 |
% Assay |
3890897 |
3896759 |
100.151 |
|
Sr. NO. |
% Composition |
Area of Standard |
Area of Sample |
% Assay |
|
1 |
% Assay |
295283 |
295185 |
99.9668 |
|
Sr. NO. |
% Composition |
Area of Standard |
Area of Sample |
% Assay |
|
1 |
% Assay |
39633 |
39730 |
100.245 |
It is observed that the assay of the formulation were found within the criteria limit.
Precision
Variations in the results were observed by performing interday and intraday of the drugs. Following are the observed results for the same.
|
Morning |
Evening |
Mean |
%RSD |
|
3890897 |
3890160 |
|
|
|
3884716 |
3883158 |
3888863 |
0.10% |
|
3893092 |
3891157 |
|
|
|
Day 1 |
Day 2 |
Mean |
%RSD |
|
3890897 |
3893449 |
|
|
|
3884716 |
3886600 |
3892884 |
0.10% |
|
3893092 |
3892884 |
|
|
|
Morning |
Evening |
Mean |
%RSD |
|
295283 |
294750 |
|
|
|
295312 |
295249 |
295087.2 |
0.08% |
|
295112 |
294817 |
|
|
|
Day 1 |
Day 2 |
Mean |
%RSD |
|
295283 |
294668 |
|
|
|
295312 |
294876 |
295017 |
0.08% |
|
295112 |
295017 |
|
|
|
Morning |
Evening |
Mean |
%RSD |
|
39633 |
39610 |
|
|
|
39540 |
39576 |
39586.33 |
0.08% |
|
39575 |
39584 |
|
|
|
Day 1 |
Day 2 |
Mean |
%RSD |
|
39633 |
39594 |
|
|
|
39540 |
39560 |
39516 |
0.08% |
|
39575 |
39516 |
|
|
As the % RSD in the above all three results were within the range ensures the repeatability of the results.
Robustness
It is performed to check the variations in the experiment i.e. in the chromatographic conditions. The results obtained were as follows.
|
Conc. (μg/ml) |
Parameter |
Condition |
Area |
Mean |
SD |
%SD |
|
200 |
Change in flow rate |
0.65 |
2905068 |
2899733 |
5026.37 |
0.17333906 |
|
|
|
0.85 |
2899046 |
|||
|
|
|
1.05 |
2895086 |
|
Conc. (μg/ml) |
Parameter |
Area |
Mean |
SD |
%SD |
|
200 |
Change in Wavelength |
2897199 |
2895475 |
4677.67 |
0.16155113 |
|
|
|
2899046 |
|
|
|
|
|
|
2890180 |
|
|
|
|
Conc. (μg/ml) |
Parameter |
Area |
Mean |
SD |
%SD |
|
6 |
Change in flow rate |
221047 |
220905 |
494.122 |
0.22368101 |
|
|
|
221312 |
|
|
|
|
|
|
220355 |
|
|
|
|
Conc. (μg/ml) |
Parameter |
Area |
Mean |
SD |
%SD |
|
6 |
Change in Wavelength |
221868 |
221490 |
327.237 |
0.14774343 |
|
|
|
221312 |
|||
|
|
|
221291 |
|
Conc. (μg/ml) |
Parameter |
Area |
Mean |
SD |
%SD |
|
0.8 |
Change in flow rate |
28725 |
28761 |
38.7427 |
0.13470582 |
|
|
|
28802 |
|||
|
|
|
28756 |
|
Conc. (μg/ml) |
Parameter |
Area |
Mean |
SD |
%SD |
|
0.8 |
Change in Wavelength |
28733 |
28760.7 |
36.4737 |
0.12681811 |
|
|
|
28802 |
|||
|
|
|
28747 |
As the RSD is less than 2% showing that the results are unaffected with the experimental changes.
Ruggedness
Wide range of concentration were injected for all the three drugs and their calibration curve was plotted as the response of analyte with the range if concentration.
|
Conc. |
Area |
|
100 |
2043536 |
|
200 |
2896093 |
|
300 |
3889571 |
|
400 |
4907803 |
|
500 |
5822486 |
|
Conc. |
Area |
|
3 |
150608 |
|
6 |
221964 |
|
9 |
295029 |
|
12 |
370883 |
|
15 |
441183 |
|
Conc. |
Area |
|
0.4 |
16812 |
|
0.6 |
28766 |
|
0.8 |
39607 |
|
1.0 |
49589 |
|
1.2 |
61511 |
Results are showing that the developed method is stable as regression coefficient of all are within the limit hence change doesn't affects the results.
|
Sr. no. |
Degradation |
Area of Standard |
Area of degraded Sample |
Degraded up to % |
Actual % degradation |
|
1 |
Acid Degradation |
5822073 |
5566418 |
95.60886646 |
4.391133536 |
|
2 |
Basic Degradation |
5822073 |
5445290 |
93.52837039 |
6.471629607 |
|
3 |
H2O2 Degradation |
5822073 |
5818895 |
99.94541463 |
0.054585368 |
|
4 |
Thermal |
5822073 |
5819926 |
99.9631231 |
0.036876899 |
|
5 |
Photolytic |
5822073 |
5821547 |
99.99096542 |
0.009034583 |
|
Sr. NO. |
Degradation |
Area of Standard |
Area of degraded Sample |
Degraded up to % |
Actual % degradation |
|
1 |
Acid Degradation |
440904 |
426845 |
96.81132401 |
3.188675993 |
|
2 |
Basic Degradation |
440904 |
413594 |
93.80590786 |
6.194092138 |
|
3 |
H2O2 Degradation |
440904 |
440145 |
99.82785368 |
0.172146318 |
|
4 |
Thermal |
440904 |
440233 |
99.84781268 |
0.152187324 |
|
5 |
Photolytic |
440904 |
440374 |
99.8797924 |
0.120207574 |
|
Sr. NO. |
Degradation |
Area of Standard |
Area of degraded Sample |
Degraded up to % |
Actual % degradation |
|
1 |
Acid Degradation |
61560 |
59446 |
96.56595192 |
3.434048083 |
|
2 |
Basic Degradation |
61560 |
58265 |
94.64749838 |
5.352501624 |
|
3 |
H2O2 Degradation |
61560 |
59546 |
96.72839506 |
3.271604938 |
|
4 |
Thermal |
61560 |
61541 |
99.9691358 |
0.030864198 |
|
5 |
Photolytic |
61560A |
60563 |
98.38044185 |
1.619558155 |
Limit of detection (LOD) and limit of quantification (LOQ)
It is calculated by slope and the standard deviation. Following are the formulas used to estimate the LOD and LOQ:
LOD= 3.3σ/S
Where, σ = the standard deviation of the y-intercept
S = slope of calibration curve of analyte
LOQ= 10σ/S
Where, σ = the standard deviation of the y-intercept
S = slope of calibration curve of analyte
The result of LOD and LOQ of respective drugs are as follows:
Metformin
LOD =1.3608,
LOQ = 4.1239
Pioglitazone
LOD = 0.04710,
LOQ = 0.14274
Glimepiride
LOD = 0.00468,
LOQ = 0.01421
Degradation studies
Five degradation parameters (acidic, basic, thermal, photolytic and peroxide) were performed to analyse the stability of all three drugs. Drugs are forcefully degraded under specified conditions and results were calculated to ensure the % degradation.
It was observed that all the three drugs are stable under the degradation parameters also. All the three drugs were carried out under five stressed conditions and the results obtained showing that the drugs are not affected that much i.e. all the results are under the limit criteria of degradation only.
Discussion
For simultaneous estimation of metformin, pioglitazone and glimepiride, an analytical method was developed and validated by UV spectroscopy and reverse phase chromatography. The proposed method was found to be specific, accurate and precise. The method was found to be linear which was performed by linearity study for all the three drugs which was studied as per their respective concentration. Around more than 0.99 regression coefficient value was observed which was within the limit. The retention time for metformin was observed at around 4.0 min, for pioglitazone it was observed 5.5 min and for glimepiride it was observed around 6.8 min. The recovery for the method was also accurate within the limit as per the guidelines only which was observed within 98% to 102%. The percent relative standard was also observed below 2 value which falls under the guidelines. No degradation interference was observed while developing and validating the analytical method. It was also observed that the results are unaffected for the small variations in the method showing the repeatability of the developed analytical method. The method was found to be simple, rapid and robust for the analysis of metformin, pioglitazone and glimepiride.
Conclusion
For the simultaneous estimation of metformin, pioglitazone and glimepiride of stability indicating analytical method development and validation in the formulation by RP-HPLC technique, the method was found to be accurate, sensitive, reproducible, linear and precise. The results which was observed was found to be relevant that are carried out as per International Council on Harmonisation guidelines. Hence, for the quality control analysis the proposed method was carried out for the routine analysis in the tablet dosage form.
Source of Funding
None.
Conflict of Interest
None.
References
- Minamii T, Nogami M, Ogawa W. Mechanisms of metformin action: In and out of the gut. J Diabetes Investig. 2018;9(4):701-3. [Google Scholar] [Crossref]
- Rena G, Hardie DG, Pearson ER. The mechanisms of action of metformin. Diabetologia. 2017;60(9):1577-85. [Google Scholar] [Crossref]
- Hundal RS, Krssak M, Dufour S. Mechanism by which metformin reduces glucose production in type 2 diabetes. Diabetes. 2000;49(12):2063-9. [Google Scholar] [Crossref]
- Madiraju AK, Erion DM, Rahimi Y, Wood JL, Bhanot S, MacDonald MJ. Metformin suppresses gluconeogenesis by inhibiting mitochondrial glycerophosphate dehydrogenase. Nature. 2014;510:542-6. [Google Scholar]
- Miller RA, Chu Q, Xie J. Biguanides suppress hepatic glucagon signalling by decreasing production of cyclic AMP. Nature. 2013;494(7436):256-60. [Google Scholar] [Crossref]
- . Explore Chemistry. . 2021. [Google Scholar]
- Hearn MTW. Ion-pair chromatography on normal and reversed-phase systems. Chromatogr. 1980;18:59-100. [Google Scholar]
- Nyola N, Jeyabalan GS. Method development of simultaneous estimation of sitagliptin and metformin hydrochloride in pure and tablet dosage form by uv-vis spectroscopy. J Pharm Pharm Sci . 2012;1(4):1392-1401. [Google Scholar]
- Neelima K, Prasad Y. Analytical Method Development and Validation of Metformin, Voglibose, Glimepiride in Bulk and Combined Tablet Dosage Form by Gradient RP-HPLC. Pharm Methods. ;5(1):27-33. [Google Scholar] [Crossref]
- Rahane RD, Rachh PR. Development and Validation of Simultaneous Estimation of Metformin Hydrochloride and Glimepiride in Physiological media. Res J Pharm Technol. 2020;13(11):5360-4. [Google Scholar] [Crossref]
- Shende AM, Budde RB. Novel RP-HPLC method development and validation for simultaneous estimation of metformin, voglibose and pioglitazone in bulk and triple fixed drug combinations pharmaceutical dosage form. J Drug Deliv Ther. 2019;9(1):30-7. [Google Scholar] [Crossref]
- Priya MV. RP-HPLC Method for Simultaneous Estimation of Metformin HCL, Ramipril and Glimepiride in Bulk and Their Combination Tablet Dosage. J Pharm Biol Sci. 2017;11(5):525-30. [Google Scholar]
- Bergh JJ, Breytenbach JC. Stability-indicating High-performance Liquid- chromatographic Analysis of Trimethoprim in Pharmaceuticals. J Chromatogr. 1987;387:528-31. [Google Scholar] [Crossref]
- Stubbs C, Kanfer I. Stability-indi- cating High-performance Liquid-chromato- graphic Assay of Erythromycin Estolate in Pharmaceutical Dosage Forms. Int J Pharm. 1990;3(2):113-9. [Google Scholar]
- Macneil L, Rice JJ, Muhammad N, Lauback RG. Stability-indicating Liquid-chromatographic Determination of Cefapirin, Desacetylcefapirin and Cefapirin Lactone in Sodium Cefapirin Bulk and Injectable Formulations. J Chromatog. 1986;361:285-90. [Google Scholar] [Crossref]
- Nirupa G, Upendra M, Tripathi. RP-HPLC Analytical Method Development and Validation for Simultaneous Estimation of Three Drugs: Glimepiride, Pioglitazone, and Metformin and Its Pharmaceutical Dosage Forms. J chem. 2013;2013:1-9. [Google Scholar]
- . About Medicine India. . . [Google Scholar]
- Jain D, Jain S, Jain D, Amin M. Simultaneous Estimation of Metformin Hydrochloride, Pioglitazone Hydrochloride, and Glimepiride by RP-HPLC in Tablet Formulation. J Chromatogr Sci. 2008;46(6):501-4. [Google Scholar] [Crossref]
- Pandit V, Pai RS, Singh G, Devi K, Narayana S, Suresh S. Development and validation of th e liquid chromatographic method for simultaneous estimation of metformin, pioglitazone, and glimepiride in pharmaceutical dosage forms. Pharm Methods .. ;3(1):9-13. [Google Scholar] [Crossref]
- Sebaiy MM, Sobhy M, El-Adl MM, Baraka AA. Rapid RP-HPLC method for simultaneous estimation of metformin, pioglitazone, and glimepiride in human plasma. Acta Chromatographica. 2020;32(1):16-21. [Google Scholar] [Crossref]
- Rishabha M, Bansal V, Pal OP, Sharma PK. High performance liquid chromatography: a short review. J Global Pharma Technol. 2010;2(5):22-6. [Google Scholar]
- Martin M, Guiochon G. Effects of high pressures in liquid chromatography. J Chromatogr A. 2005;7(1-2):16-38. [Google Scholar] [Crossref]
- Sahoo PK, Sharma R, Chaturvedi SC. Simultaneous Estimation of Metformin Hydrochloride and Pioglitazone Hydrochloride by RPHPLC Method from Combined Tablet Dosage Form. J Pharm Sci. ;70(3):383-6. [Google Scholar] [Crossref]
- Liu Y, Lee ML. Ultrahigh pressure liquid chromatography using elevated temperature. J Chromatography. 2006;1104(1-2):198-202. [Google Scholar] [Crossref]
- Abidi SL. High-performance liquid chromatography of phosphatidic acids and related polar lipids. J Chromatogr. 1991;587(2):193-203. [Google Scholar] [Crossref]